
AME was asked to evaluate the differences between different lots of floor tiles from MSI with respect to their appearance, cleanability, and roughness by a dissatisfied homeowner. MSI, however, embraced the wide variances between lots, though many would consider this a lack of quality control. Our report on the large variances is offered below. The report also offers an example of the use of quantitative surface roughness parameters available using the 3-dimensional high resolution capabilities of our Keyence VHX-7000N Digital Optical Microscope. Below is a snippet of the report.
Summary
The principal results of the optical microscopy, surface profilometry, and LIBS analysis of the MSI Cementino Gray Matte Porcelain Floor Tiles described by the home owner as Good and Bad are:
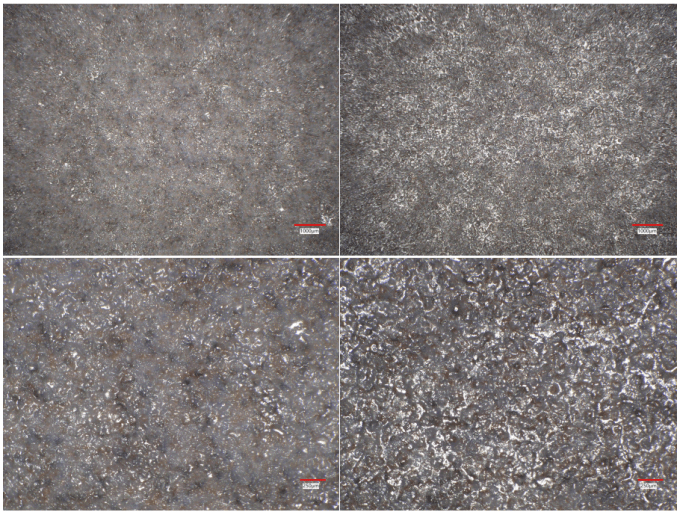
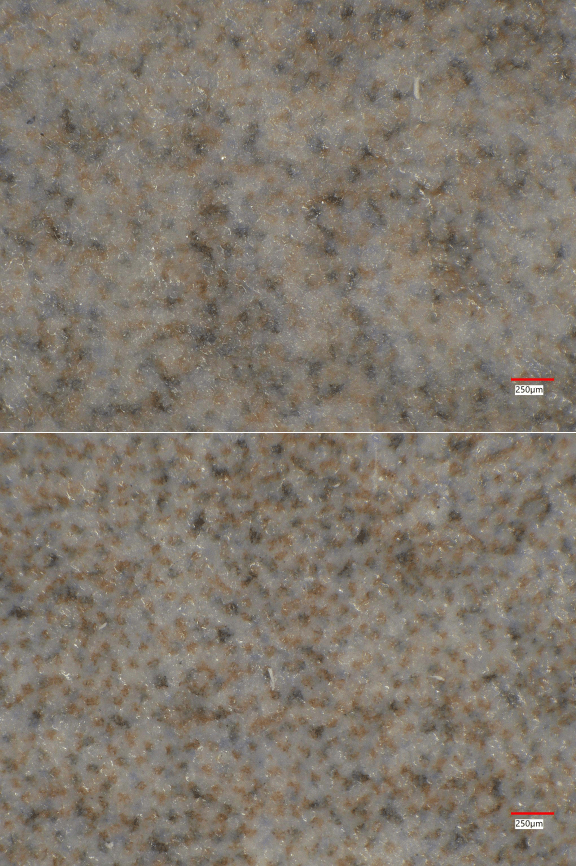
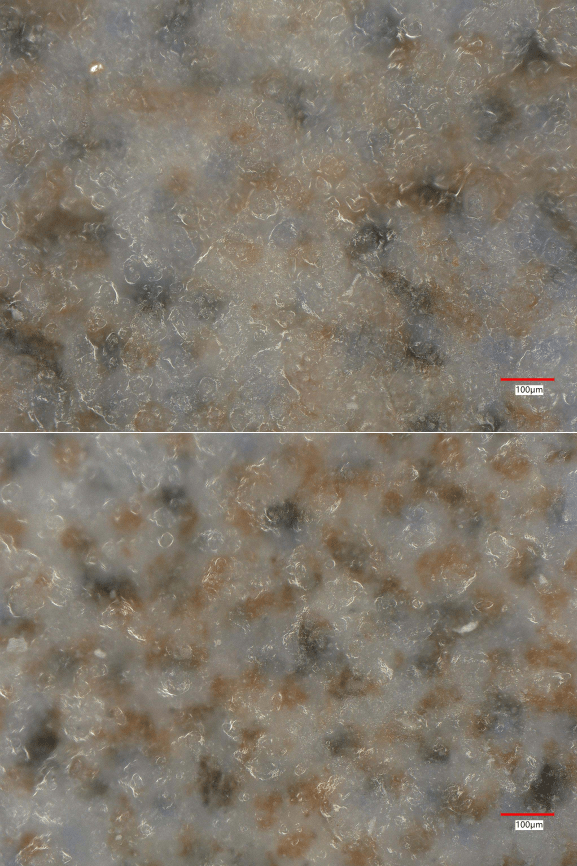
- The Good floor tile is more reflective. The Bad floor tile scatters light more. This causes them to appear differently.
- The composition of the glazes of the Good and Bad tiles appear to be very similar.
- The translucent glaze particles were spread more evenly over the Good tile than over the Bad tile prior to partially melting them. The glaze particles on the Bad tile were less completely melted than were those on the Good tile. The colorant layer beneath the glaze is often obscured by those areas of deeper glaze on the Bad floor tile. This adds to the different appearance of the Bad floor tile compared to the Good floor tile.
- The surface roughness of the Bad floor tile is much greater than that of the Good floor tile. This was demonstrated by six measurements on each tile of surface roughness parameters. This difference in surface roughness is a major cause of the difference in light reflectivity. The increased surface roughness of the Bad floor tile will cause it to feel different when walked upon barefoot. It will also make it harder to clean.
- These differences show a lack of quality control on the part of the tile manufacturer. If the buyer is shown Good tile, but Bad tile is delivered, then the buyer has a right to feel the victim of a bait and switch. MSI has responded to the homeowner by email on 8 March 2024 from Bhavesh Gandhi with a claim that they are not responsible for differences between different lots of tiles. Future buyers need to understand that MSI embraces low quality control standards.
Floor Tile Roughness – Samples and Background
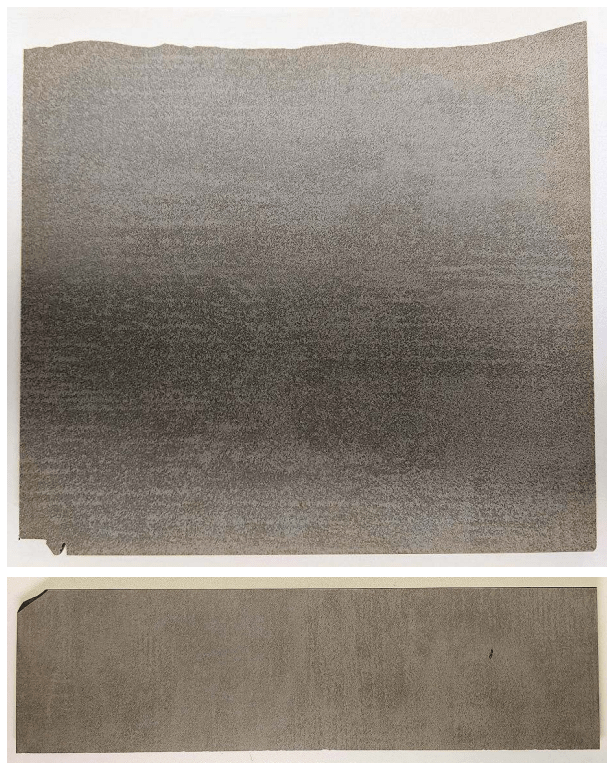
We received MSI Cementino Gray Matte Porcelain floor tile samples on 23 January 2024 from the homeowner so we could determine the differences in the tile samples with optical microscopy, surface profiling and roughness measurements, and Laser-Induced Breakdown Spectroscopy (LIBS) for elemental analysis. We received samples labeled Good (Lot 230710) and Bad (Lot 230709) by the homeowner. Judging by the lot numbers, the Bad tiles were made in the lot just prior to the good tile lot, so it is unlikely that these lots were manufactured with a long interval of time between them. The homeowner believed the Good tile lot looked better and cleaned more easily than did the Bad tile lot. These samples are shown in Figure 1.
Optical Microscopy and LIBS Analysis
The samples were examined with a Keyence VHX-7000N Digital Optical Microscope, equipped with an EA-300 Laser-Induced Breakdown Spectroscopy (LIBS) unit.
This digital microscope has lenses providing zoom magnification from 20 to 2000 times with a 4K CMOS image sensor. The sample stage and the lens are motorized. It has the ability to acquire images many distances above the sample and reconstruct an image from the in-focus areas from each of the many images. The resulting images are capable of showing features at higher magnification that one could otherwise only see with an SEM, which has a much greater depth-of-field than does an optical microscope. It can image very large areas by automatically making multiple adjacent images and then stitching them together. The microscope has axial through the lens and ring lighting. It can also provide lighting from various angles. Both 2-dimensional and 3-dimensional distance measurements can be made. The instrument can make particle size analyses and grain-size analyses using advanced automatic image analysis. Surface topography profiles can be acquired. Surface roughness measurements can also be made.
The EA-300 LIBS elemental analyzer focuses pulses from a 355 nm laser beam on a surface. Depending upon the power chosen, a crater of either about 10 or 20 micrometers in diameter is formed in the material surface as ionized material is ejected from the surface. The depth of the crater is commonly about 5 to 7 micrometers. The de-excitation of the resulting plasma emits characteristic radiation in the deep ultraviolet, visible, and near infrared range (185 – 960 nm wavelength). The emitted light is analyzed through the lens by a 1 by 1.8 inch 3.19-megapixel CMOS image sensor. Each pixel is analyzed over a 16-bit intensity range for the RGB color. The elements in the plasma are identified semi-quantitatively from this intensity and color data. Small areas in a larger sample and small particles of contamination can be elementally analyzed for all the elements, including H, Li, Be, B, C, N, O, F, Na, Mg, Al, Si, P, S, and heavier all the way to U.
Linear and surface roughness parameters can be measured for a surface along a line or for a surface area. The 3-dimensionally focused surface can be referenced to a fitted plane for tilt correction or to fitted spheres or cylinders. The measured surface parameters are:
Sa, Arithmetic mean deviation
Sq, Root mean square deviation
Ssk, Skewness
Sku, Kurtosis
Sp, Maximum peak height
Sv, Maximum valley depth
Sz = Sp + Sv
If you would like to see the rest of the analysis, you can see the full report here.