
- The TMA dilatometer uses interchangeable probes at varied loads to make a number of measurements, including the softening temperature or glass transition temperature, tensile modulus, compression modulus, the thermal expansion, melting temperature, crystalline phase transition temperature, crystalline to amorphous transition temperatures, shrinkage, warping, stress relaxation, and creep under load, by measuring the change of a dimension of a material. Note that the thermal expansion of a material may not be linear or may be linear over some temperature ranges and not over others. Where it is linear, it is called the coefficient of thermal expansion or the CTE.
- DSC can also be used to measure glass transition temperatures, crystalline phase transition temperatures, crystalline phase transformation temperatures, and melting point temperatures. DSC has the advantage of measuring transition energies, but it often is not as sensitive to detection of the transition. In many cases to see a polymer glass transition temperature, the temperature must be ramped at a high rate such as 20°C/min. This means interior material temperatures may lag those at the surface of the material, making the glass transition temperature appear to be somewhat higher than it really is.
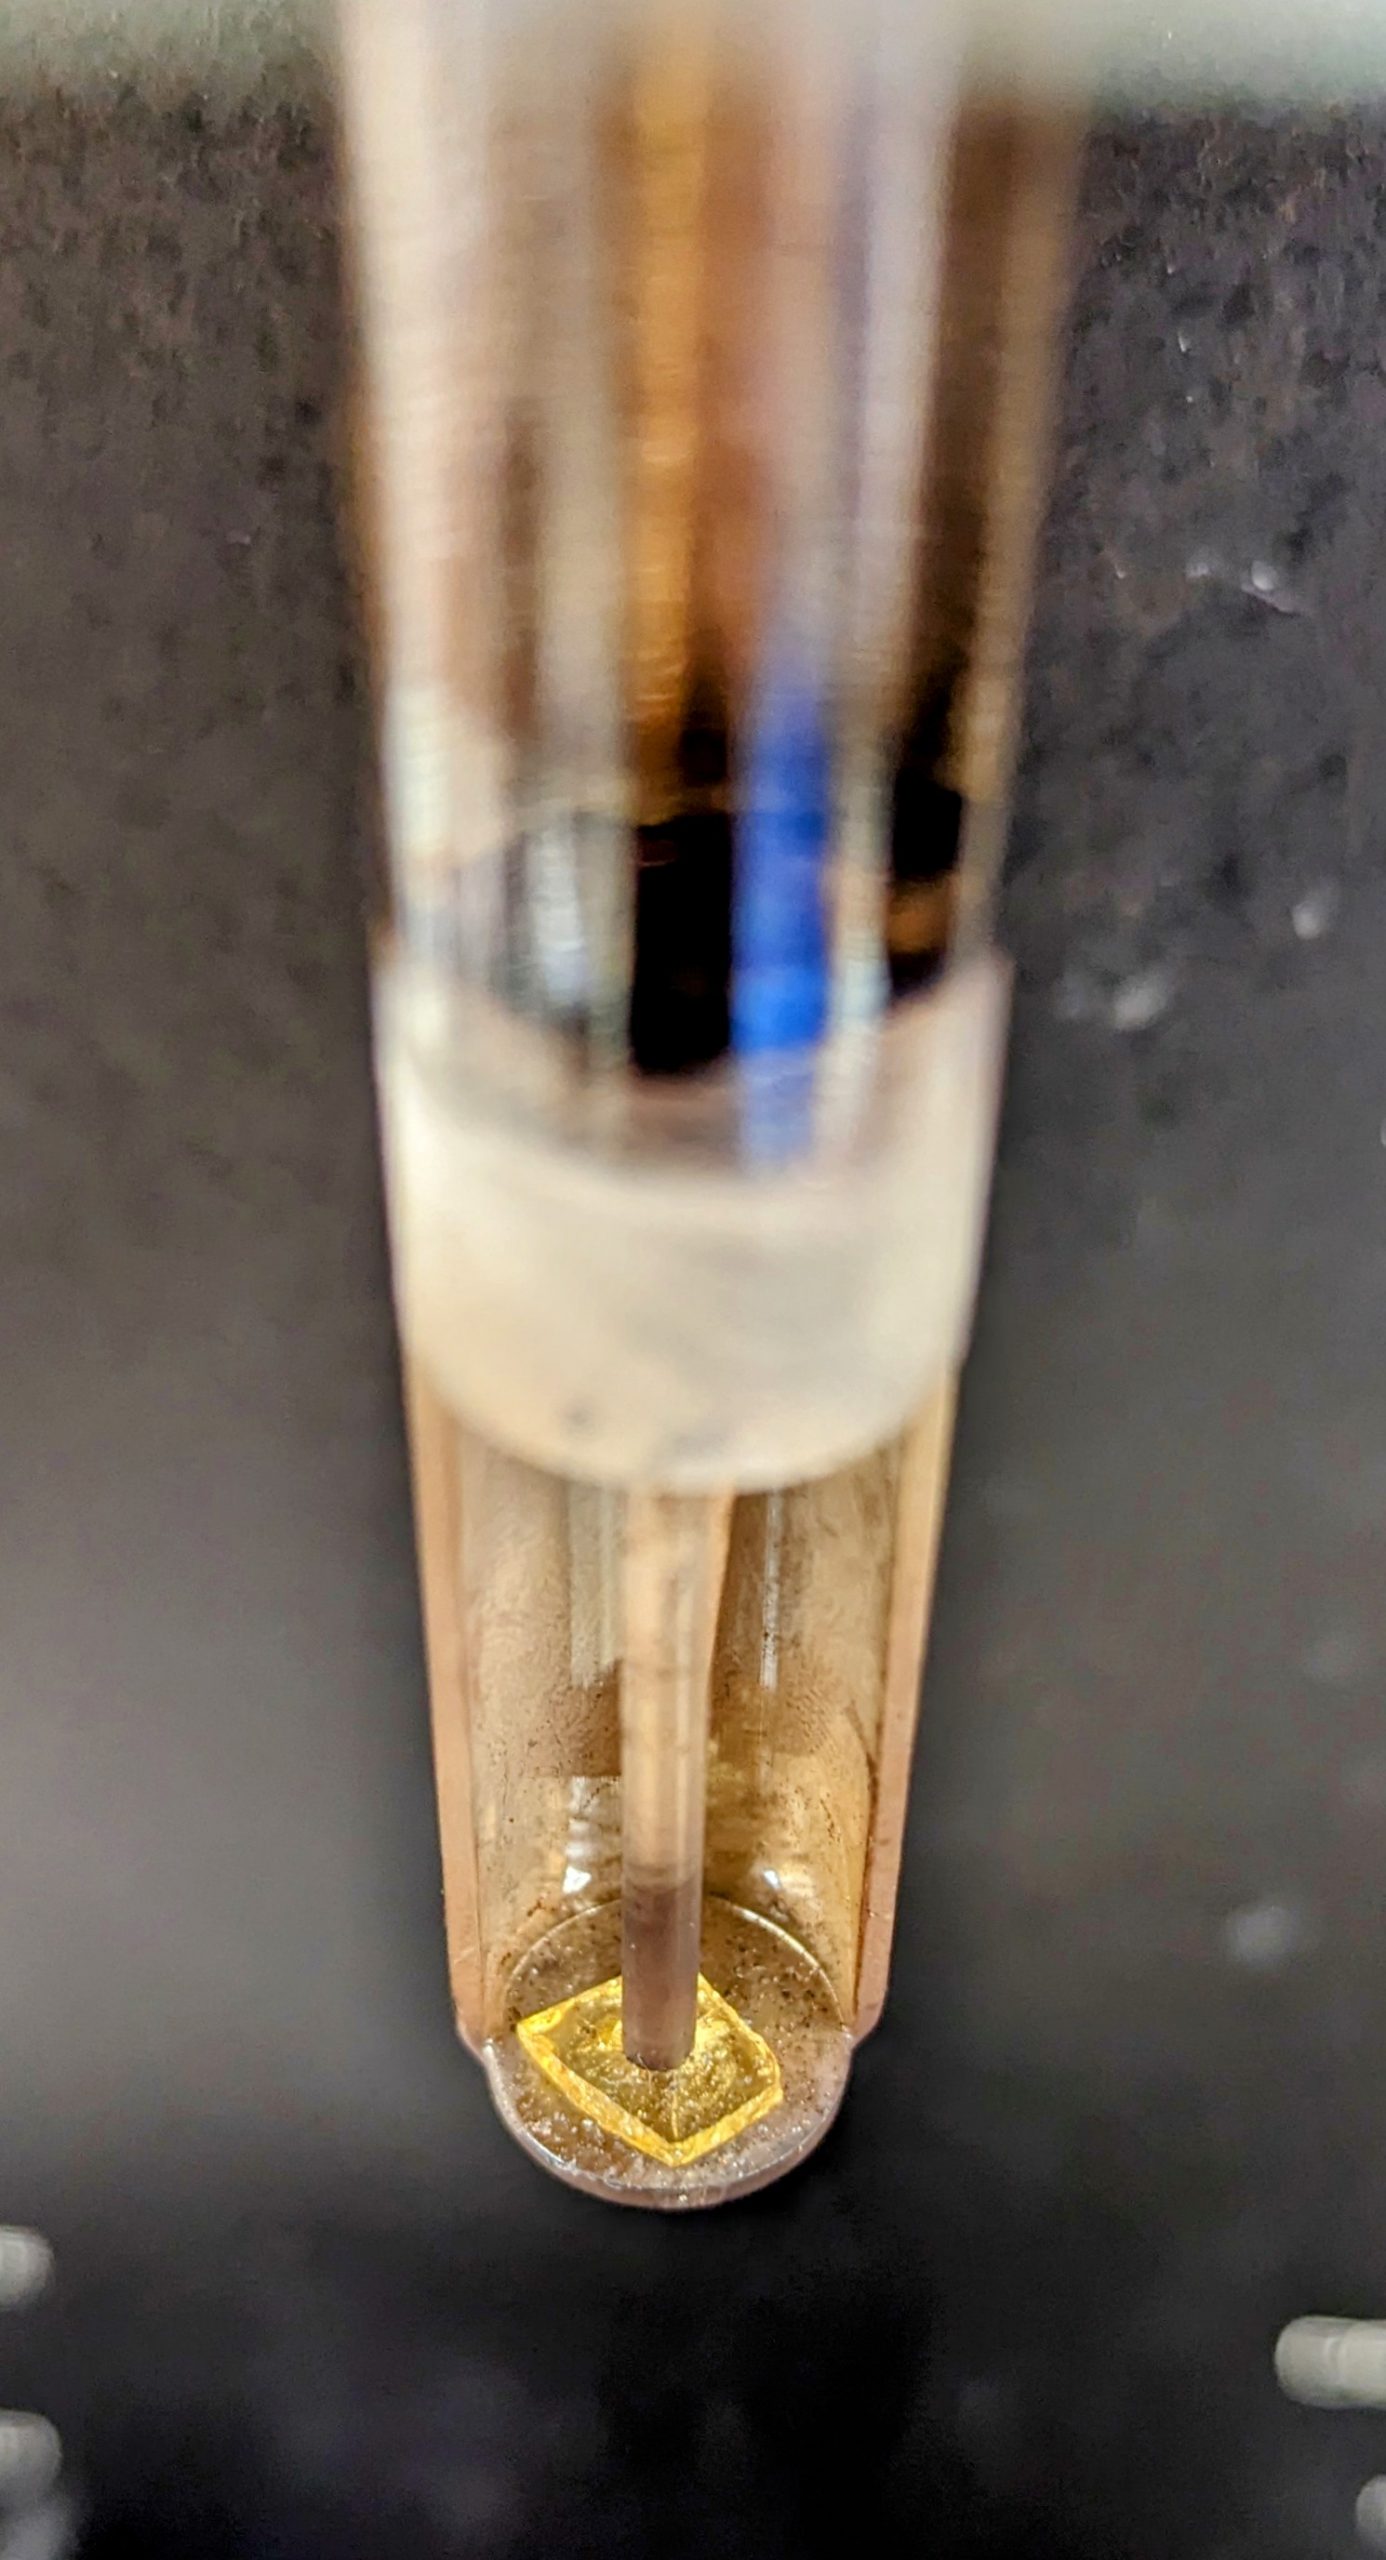
- Samples in the form of plugs, films, powders, or fibers, are compressed or held in tension by a probe assembly. Movement of the probe is measured electrically by a linear variable differential transformer (LVDT) attached to the probe.
- Capable of testing polymers and plastics, metals, glasses, ceramics, inorganic materials, composite materials, IC packages, semiconductors, small devices, adhesives, sealants, potting compounds, PCBs, and coatings.
- Our TMA is a TA Instruments Model 943 thermomechanical analyzer controlled by an Instrument Specialists Inc. (ISI) Windows-based software package.
- Temperature range from -150°C to 800°C.
- Sample dimensions: a maximum of 25 mm in height and 9.5 mm in diameter. An ideal thickness for sheet materials is 1-4mm. Taller samples should have at least one small lateral dimension, so the sample interior temperature will not differ substantially from the surface temperature. This is less a concern the more thermally conductive a sample is.
- The applied load can range from 0-100 g. The softening with temperature under various pressures can be examined in this way.
- The change of dimension must be greater than 0.002 μm/°C for a successful measurement. Note that the change of dimension is the sample length times the coefficient of thermal expansion.
- The thermal expansion and the glass transition temperature will often change when a quantity of a filler is added to a polymer resin, such as carbon black, calcium carbonate, aluminum trihydrate, talc, magnesia, alumina, or other filler materials.
ASTM Test Methods
- ASTM D696 – Standard Test Method for Coefficient of Linear Thermal Expansion of Plastics Between -30oC and 30oC with a Vitreous Silica Dilatometer
- ASTM E228 – Standard Test Method for Linear Thermal Expansion of Solid Materials with a Vitreous Silica Dilatometer
- ASTM E831 – Standard Test Method for Linear Thermal Expansion of Solid Materials by TMA
- ASTM E1545 – Standard Test Method for Assignment of the Glass Transition Temperature by TMA
Inquiries specifically about TMA analyses should be directed to Vaidheeshwar Ramasubramanian, Ph.D. by phone or at vaidheeshwar.r@andersonmaterials.com
Illustrative Example 1: Rapid Thermal Expansion of PTFE Crystalline Phase
TMA dilatometry was used to characterize the properties of various PTFE powder materials. These were examined after pressing them into sheets. The sheet thickness was measured from -100°C to 200°C using a ramp rate of 4°C/min. The first of several TEFLON® materials (Figure 1) exhibits an extensive crystalline transition at approximately 19°C due to a transformation of the Phase II helix crystal structure first to the Phase IV hexagonal crystal structure and then to the Phase I hexagonal crystal structure. This large peak created at transition indicates a PTFE which has a substantial crystalline phase and exhibits a drastic dimension change as it changes the crystalline phase. Also shown by the TMA is the softening point (Tg or Ts) of the TEFLON® at approximately 160°C. Data for another of several samples is seen in Figure 2. This TEFLON® material exhibits a significantly smaller crystalline to amorphous transition dimension increase compared to the material observed in Figure 1. This material initially consisted of a greater concentration of amorphous material. For our customer’s intended use, a rapid thermal expansion of a PTFE material at the crystalline transition temperature could not be tolerated. Their requirement was therefore for an amorphous PTFE material. Note that the first PTFE material has almost no temperature range with a linear thermal expansion characteristic.

Fig. 1. Thermal expansion of a TEFLON® material with a high degree of crystallization.

Fig. 2. Thermal expansion of a TEFLON® material with a slightly lower degree of crystallization and a greater overall thermal expansion.
Illustrative Example 2: Determination of Softening and Melting Temperatures of a Novel Thermoplastic Polymer for New Product Development
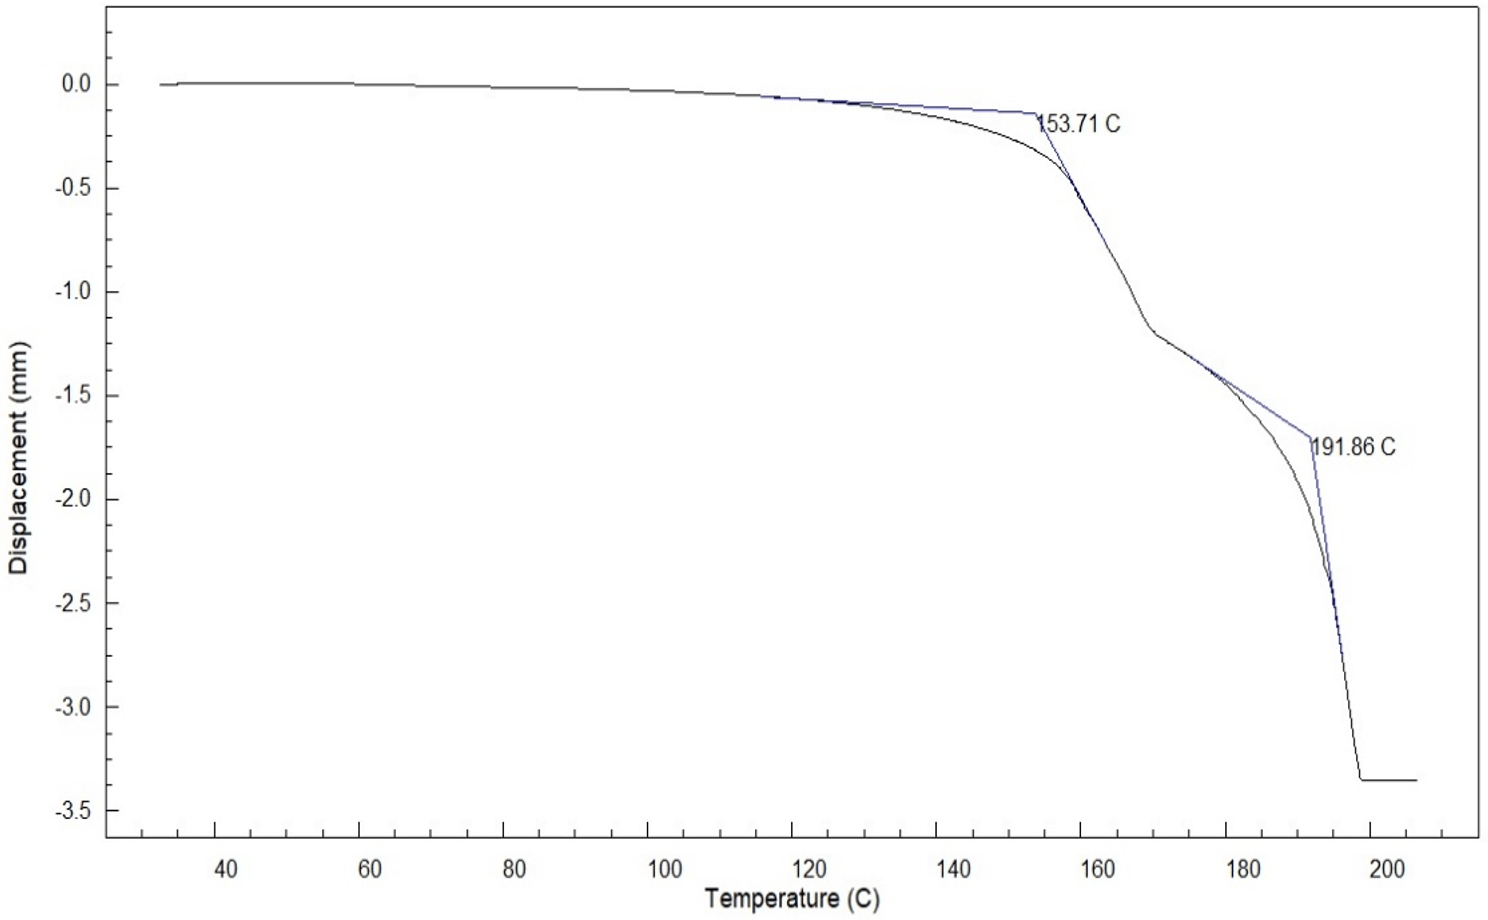
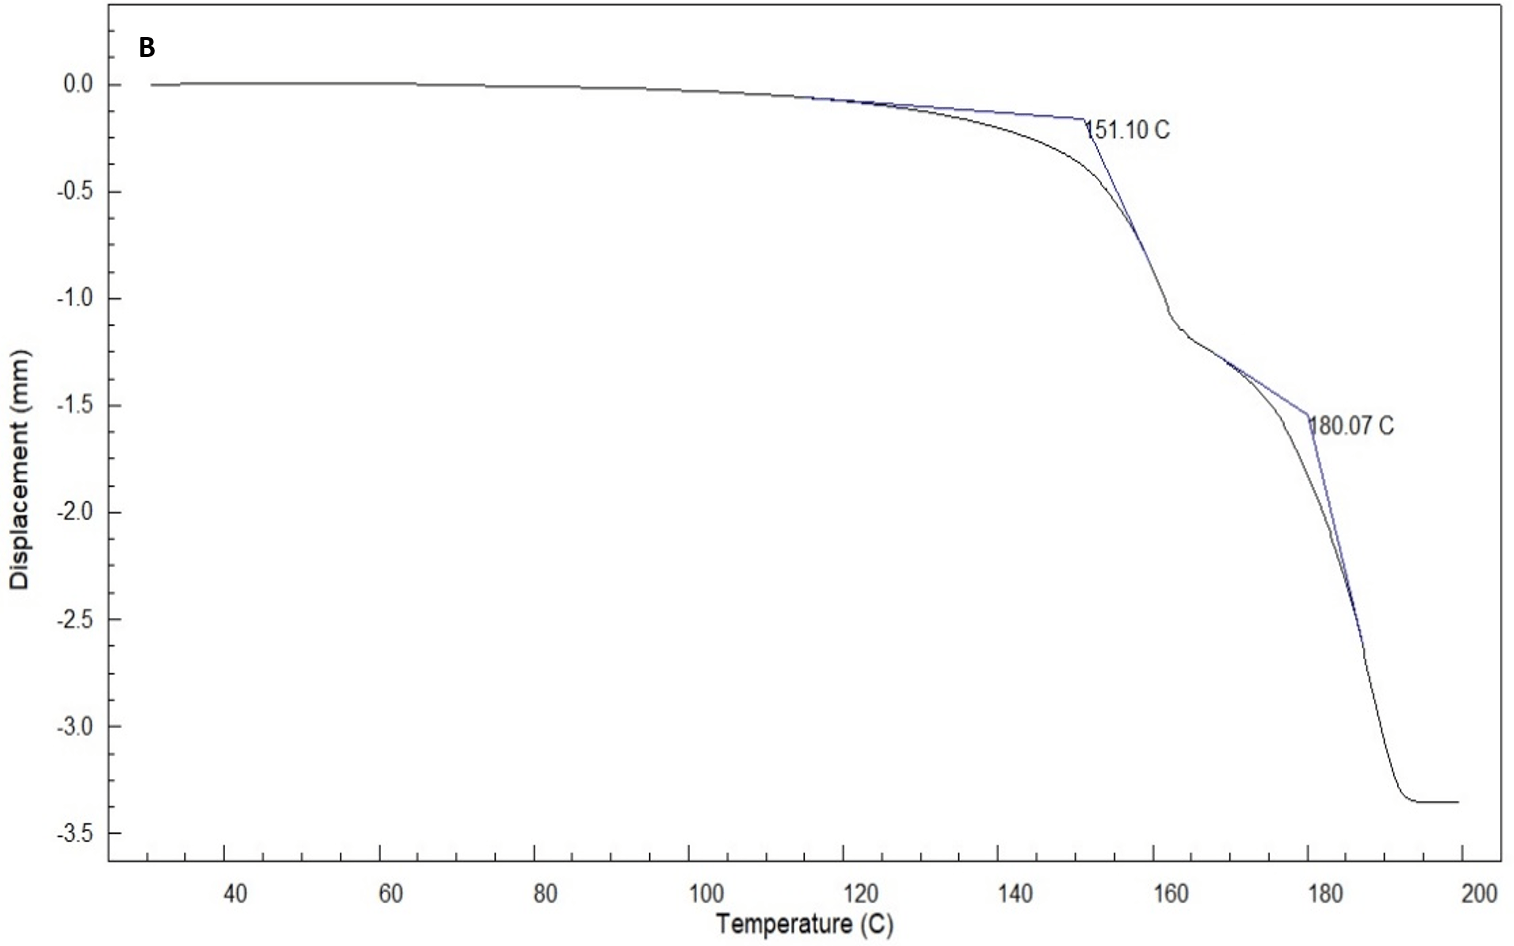
In support of a new product development, AME performed TMA analysis on thermoplastic Samples A and B to determine their softening and melting temperatures. Each sample was placed under a penetration probe with a 50g load. The sample was then heated from 25°C to 225°C at a rate of 10°C/min in dry nitrogen atmosphere (flow rate – 25 mL/min). For a 1g load the TMA thermogram exhibited only a melting peak (at very small loads, the softening and melting temperatures are very close) at 205°C. This instrument can take a load up to 150g thus enabling us to study the softening and melting points over a wide range of load.
For Samples A and B, the softening temperature (150°C – 155°C) is readily distinguishable from the melting point region (180 °C to 192 °C) using a 50 g load. Sample A exhibited a high softening and melting temperature compared to Sample B. Identification of these subtle differences in the thermal properties of these materials enables optimizing the material composition of the novel thermoplastic polymer for the product application.
Contact: Vaidheeshwar Ramasubramanian, Ph.D., e-mail: Vaidheeshwar.R@andersonmaterials.com