XPS Quantitative Elemental Analysis Illustrative Example: Analysis of an Emerald Gemstone
Figure 1 below shows the XPS elemental survey spectrum of an emerald gemstone surface. A small-spot Al x-ray source excites photoelectrons from the surface. An XPS survey spectrum consists of photoelectrons, Auger electrons, and secondary electrons with respect to the binding energies of the electrons in photoelectron peaks. These binding energies identify the elements from which the electrons were emitted. Before collecting the survey spectrum, the surface of emerald was sputtered with 4KeV Ar ions for 12 seconds to remove surface adsorbed hydrocarbon impurities. The survey analysis was carried out in a common binding energy range of 0-1100eV with a step size of 0.5eV. The 0.5eV step size is finer than the industry standard to allow the more accurate measurement of peak areas for quantitative results. Figure 2 is the enlarged 0-250eV binding energy region of Figure 1. Note the high signal-to-noise ratio, which again enhances the quantitative accuracy and detection sensitivity.
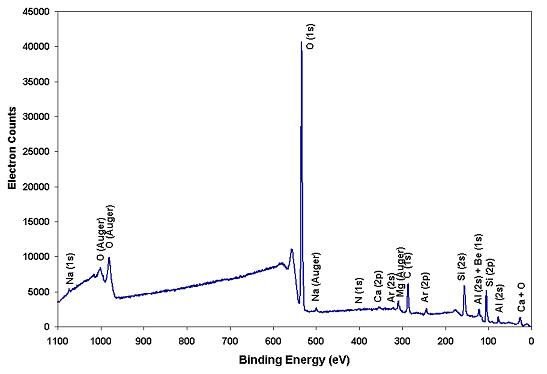
The elemental compositions (at.%) on the surface of emerald detected by XPS are listed in Table 1 below.
| Table 1 | |
|---|---|
| Element | At.% |
| Na | 0.79 |
| Al | 4.78 |
| Mg | 0.91 |
| Be | 6.12 |
| Si | 16.90 |
| C | 14.51 |
| Ca | 0.49 |
| N | 0.55 |
| O | 54.97 |
A typical emerald is a beryl or a beryllium aluminum silicate compound with a formula Be3Al2Si6O18 (3BeO • Al2O3 • 6SiO2). Na, Li and Cs may replace Be, reducing the BeO content. It may also contain Mg, Ca, Cr and other elements. The carbon is due to surface adsorbed hydrocarbons and graphitic carbon inclusions. Table 2 lists the at.% comparison between a typical beryl and the gem emerald from the present study after removal of the carbon.
| Table 2 | |||
|---|---|---|---|
| Component | Present Study (At.%) | Beryl (at.%) | % Beryl Value |
| BeO | 14.32 | 20.69 | 69.21 |
| Al2O3 | 13.98 | 17.24 | 81.11 |
| SiO2 | 59.31 | 62.07 | 95.55 |
| Na2O | 1.38 | – | – |
| MgO | 1.06 | – | – |
| CaO | 0.57 | – | – |
| Others | 9.38 | – | – |
We see that most of the substitutions by the additional elements found in this rather poor gem stone resulted in the reduction of the BeO content and also a significant reduction in the Al2O3 content. These substitutions may account for some of the flaws observed microscopically in this gem stone and its lack of brilliance after cleaning off covering oils.
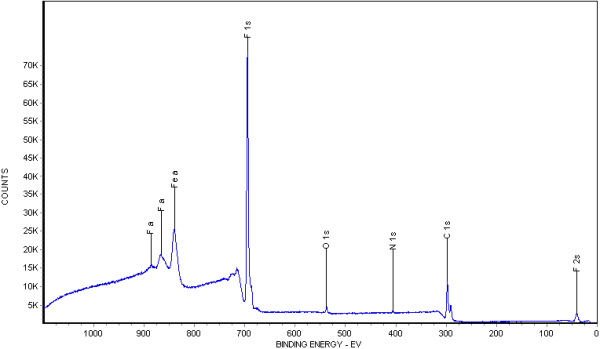
Example of the Surface Analysis of Coated and Stripped Polyethylene Fibers This is also an example of a report.
We discuss the issues of whether quantitative elemental composition analysis of a sample is best obtained using EDX or XPS or both techniques elsewhere.