
Metallography is the study of the structure of metals and alloys. Metallographic analysis can be used as a tool to help identify a metal or alloy, to determine whether an alloy was processed correctly, to examine multiple phases within a material, to locate and characterize imperfections such as voids or impurities, or to observe damaged or degraded areas in failure analysis investigations. The method most often used in such evaluations is microscopy. Both optical and scanning electron microscopy with energy-dispersive x-ray analysis (SEM/EDX) can be useful in metallographic analysis. X-ray photoelectron spectroscopy is also useful in the measurement and identification of carbides and graphitic inclusions and intermetallic formation.
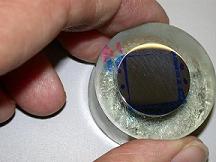
Samples prepared for metallographic microscopy are often first set into an epoxy potting compound, although this step may not be necessary if the specimen to be examined is large enough and sturdy enough to undergo grinding and polishing without a supporting material. The document ASTM E 3, “Standard Guide for Preparation of Metallographic Specimens,” describes recommended procedures for preparing a number of different metals and alloys. Once the specimen surface is polished to the desired level it may be examined immediately or it may be etched. Chemical or electrochemical etching is performed in cases where grain structure is of interest. Grain boundaries are preferentially attacked during the brief exposure to the etchant, leaving behind a surface wherein the two-dimensional grain structure can be clearly seen.
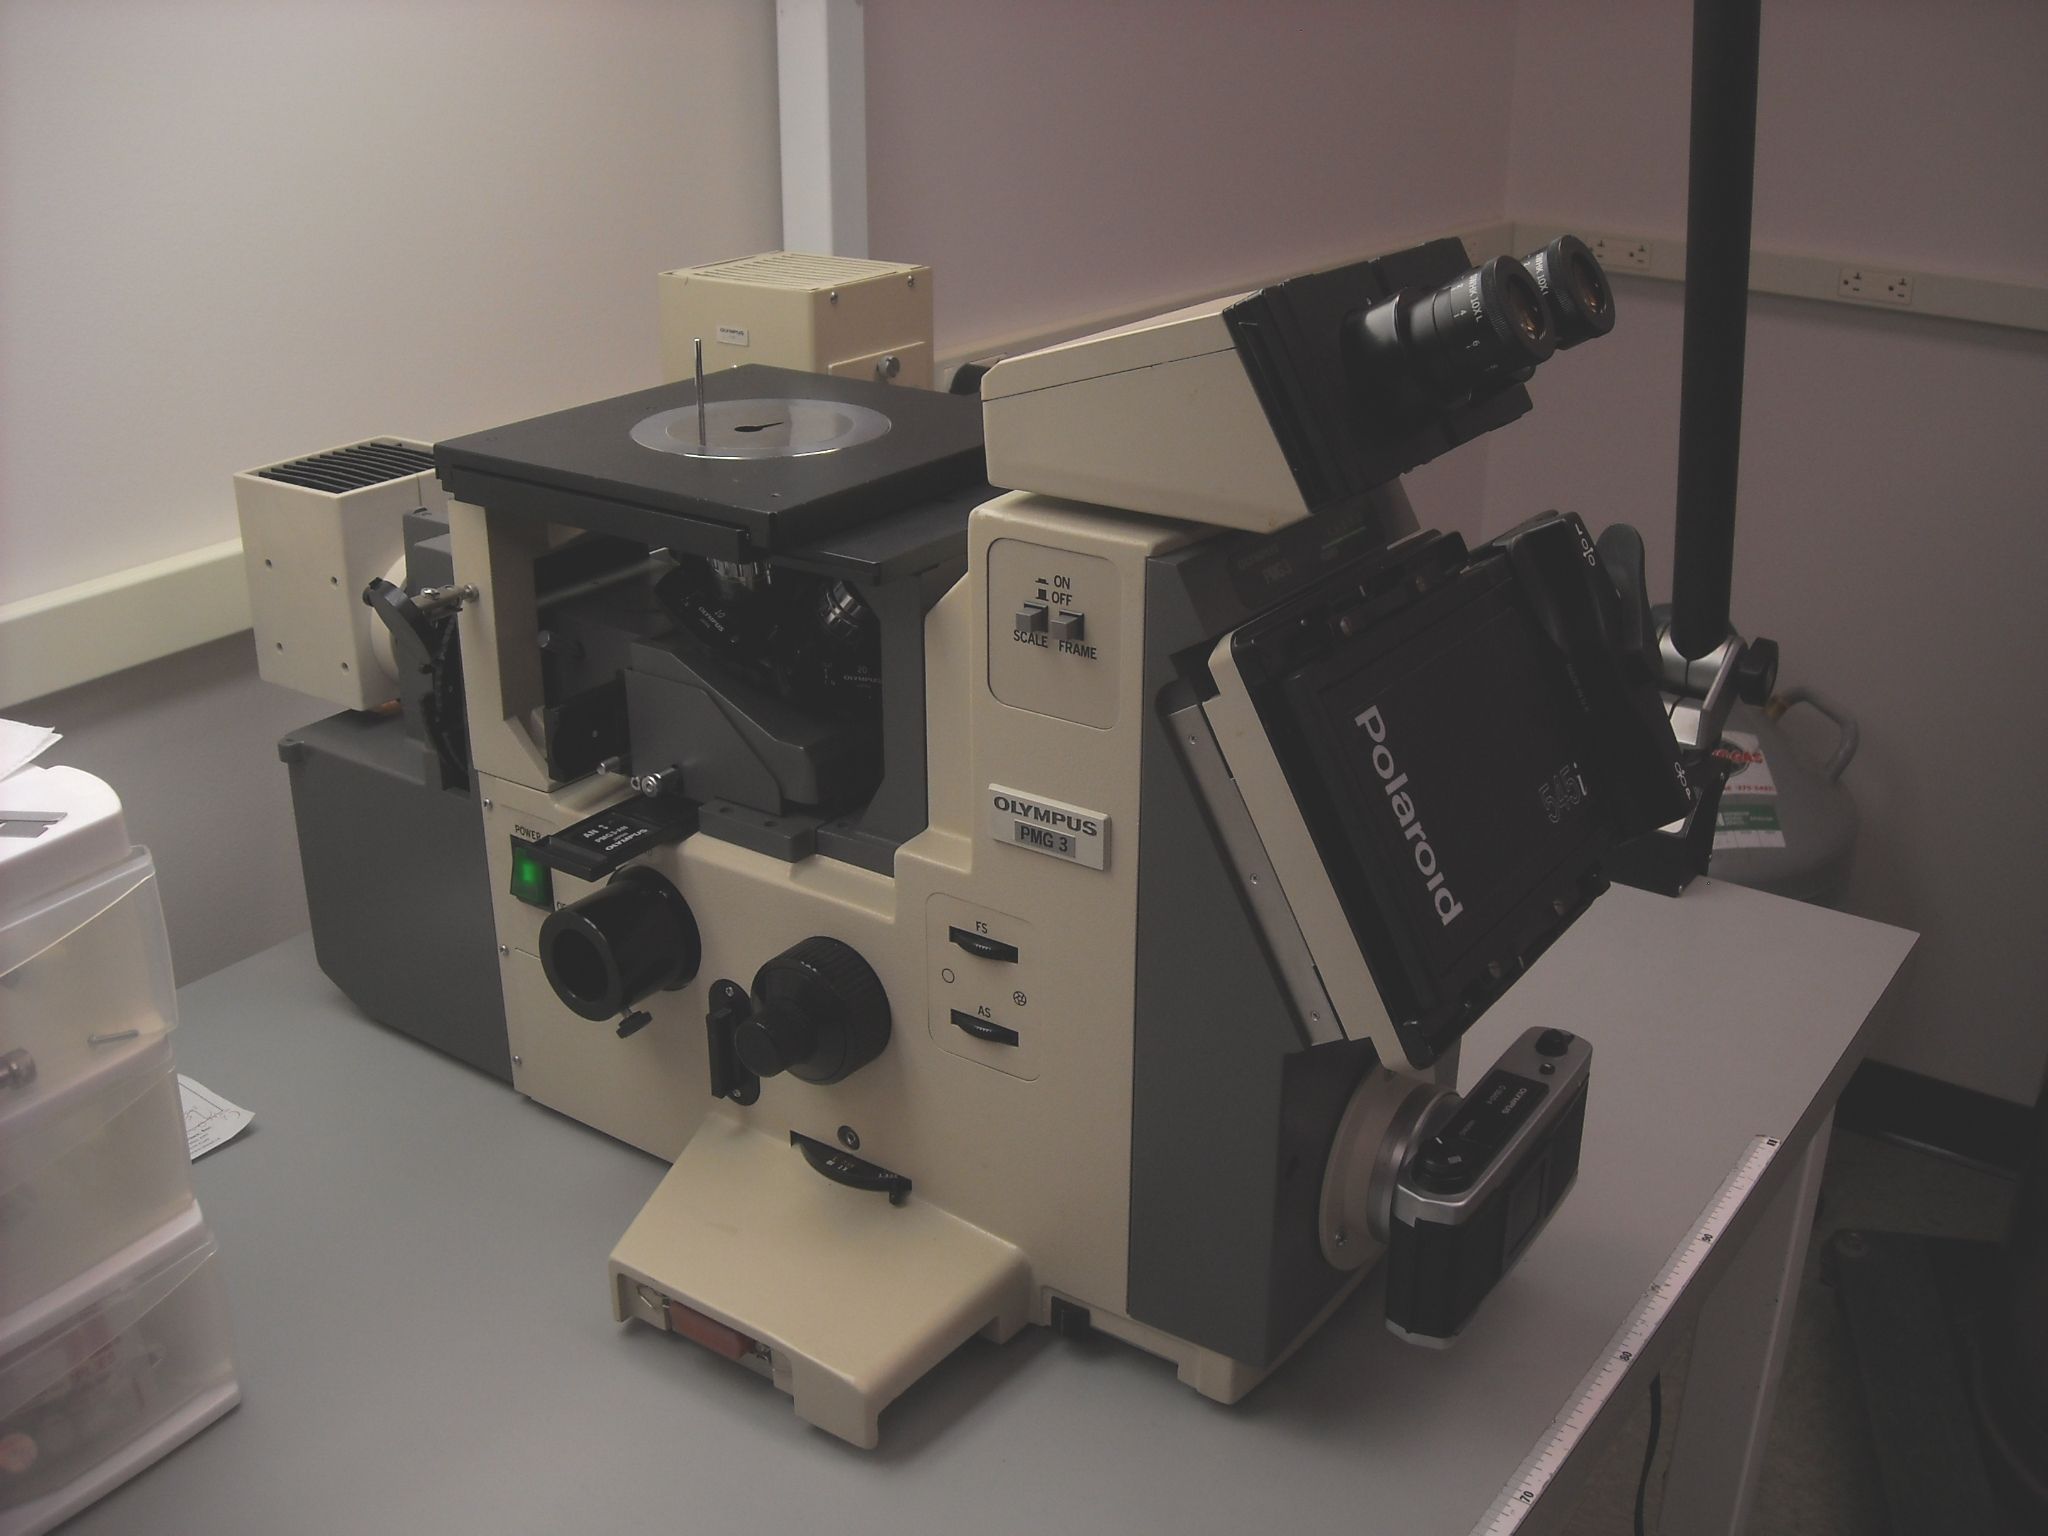
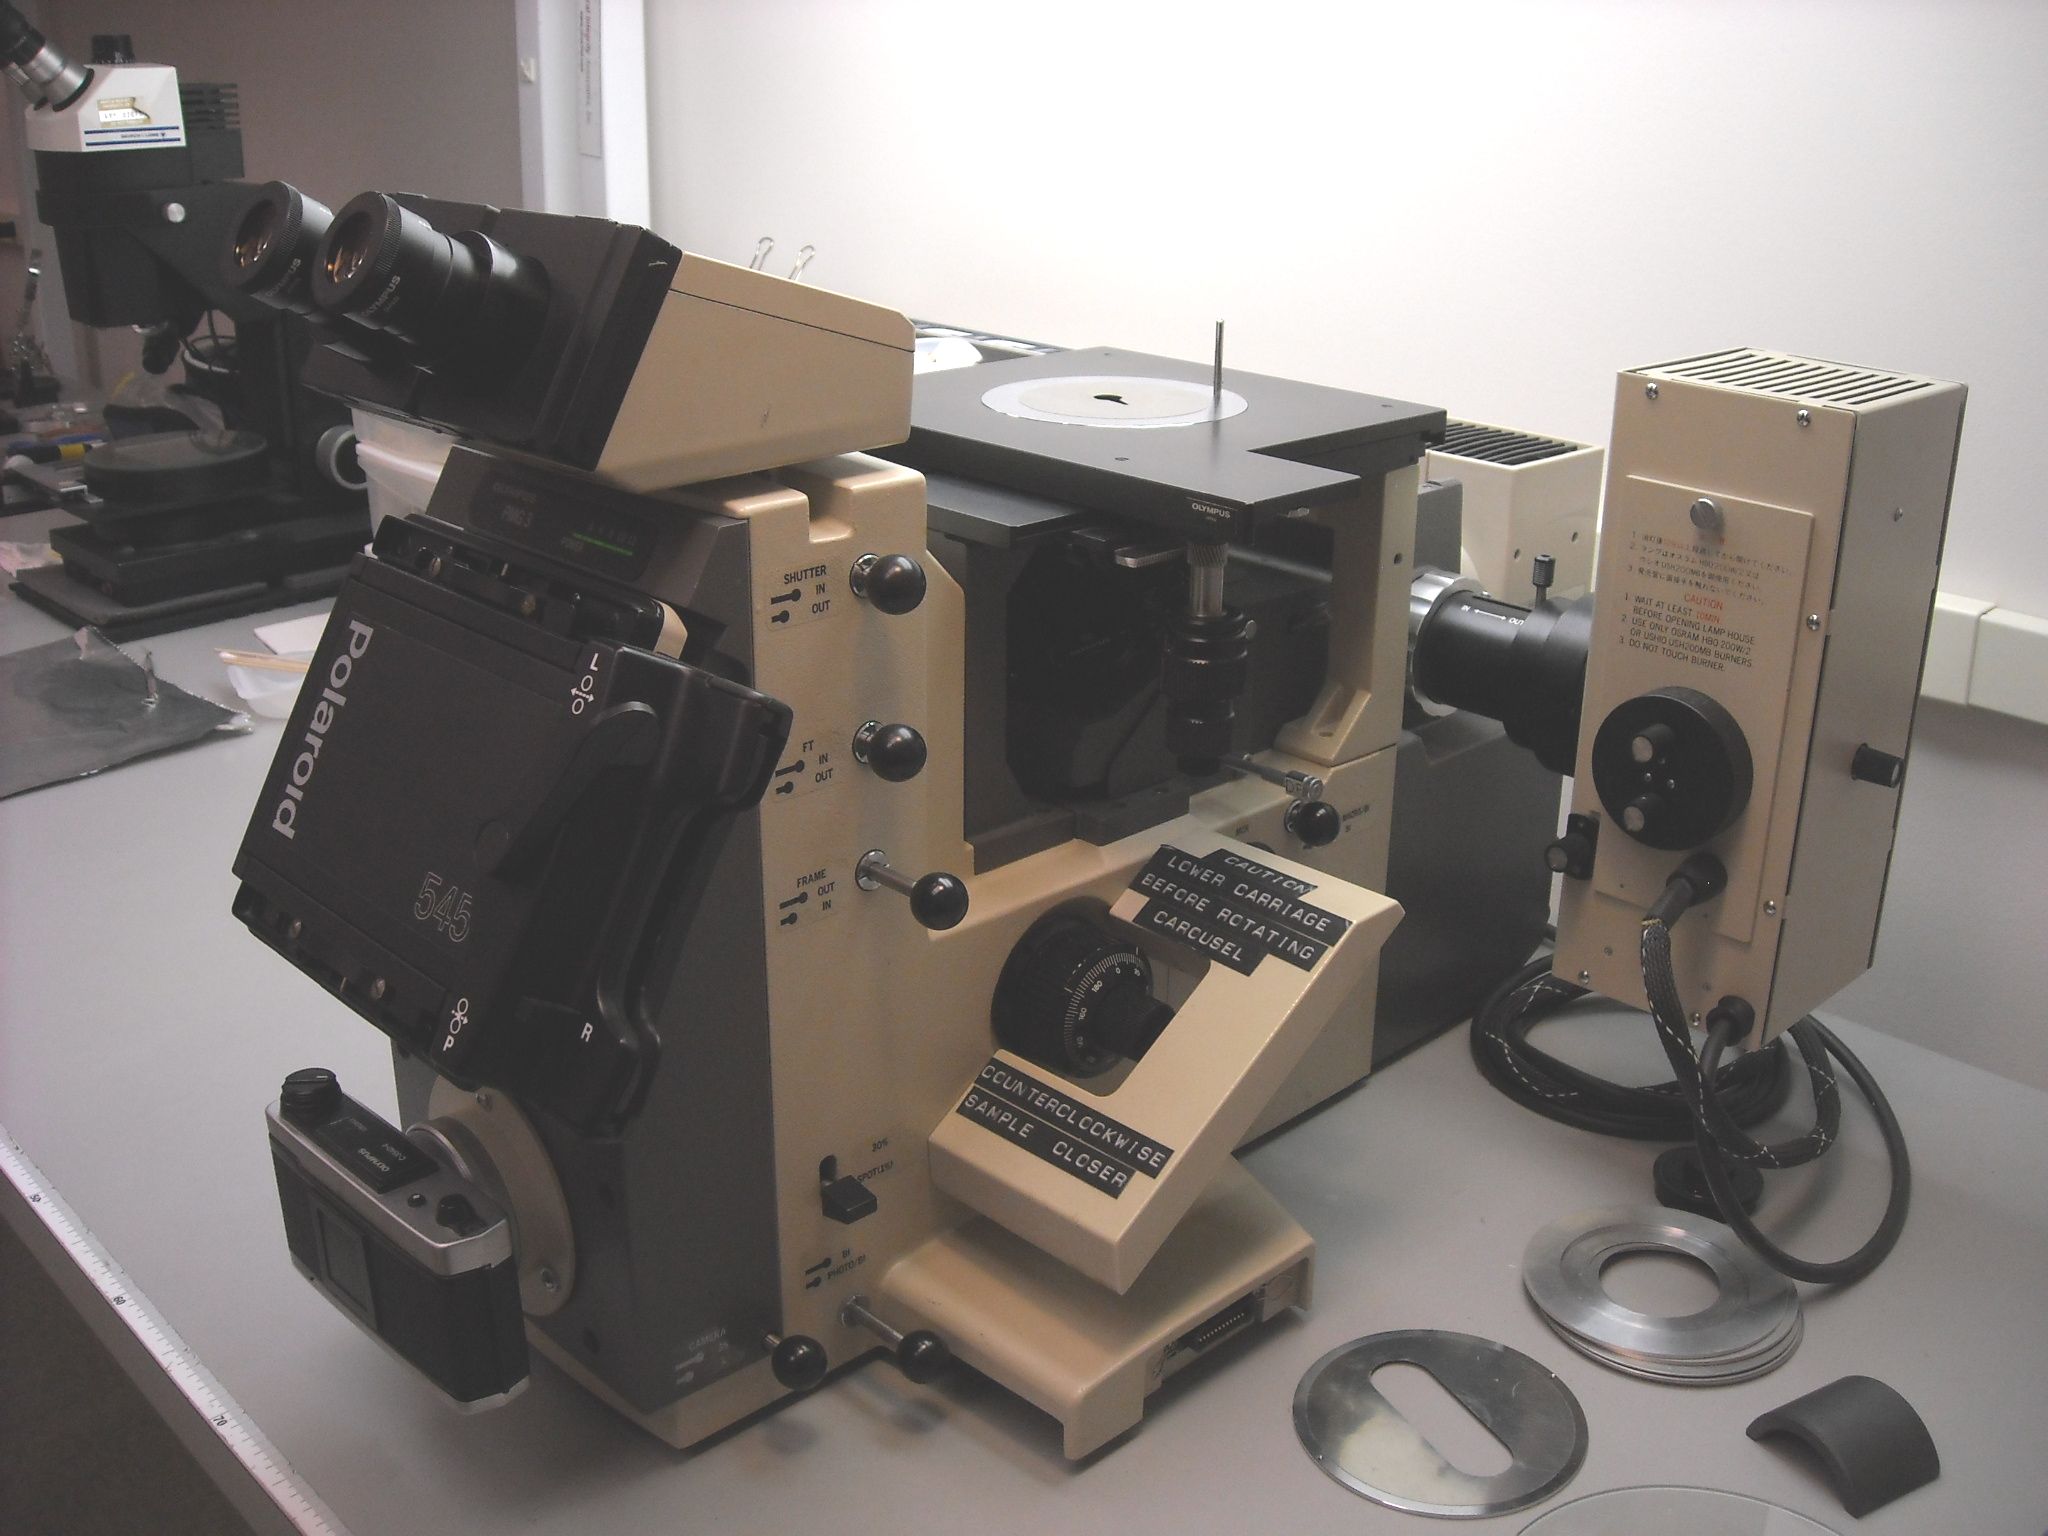
We examine polished metal samples with an Olympus PMG3 Inverted Research Metallurgical Microscope equipped with bright field, dark field, neutral density filters, polarizer with ¼ plate, and Nomarski differential interference contrast. This microscope is also excellent for examining microelectronics wafers and dies. Alternatively, we can examine metallographically etched specimens with our digital SEM/EDX.
Metallographic analysis may determine such issues as:
- Grain size and growth
- Grain structure resulting from processing
- Intermetallic phase microstructures
- Carbide formation at surfaces and grain boundaries
- Equiaxed or columnar grains
- Chemical microsegregation
- Microshrinkage and porosity
- Inclusions
- Planar, cellular, and dendritic interfaces
- Microstructures as a function of cooling rate
- Grain size as a function of work hardening
- Graphite structures in cast irons
- Graphite near surfaces transitioning into carbides with depth
- Silicon structures in Al-Si alloys
- Copper and magnesium segregation to the surface in aluminum alloys
- TiAl intermetallic structure in Ti-6Al-4V alloy
- Nomarski interference can color code height differences or chemical phase differences affecting the index of refraction of the different phases
ASTM Test Methods for Metallography
- ASTM E3 – Standard Guide for Preparation of Metallographic Specimens
- ASTM E45 – Standard Test Methods for Determining the Inclusion Content of Steel
- ASTM E112 – Standard Test Methods for Determining Grain Size
- ASTM E407 – Standard Practice for Microetching Metals and Alloys
- ASTM E562 – Standard Test Method for Determining Volume Fraction by Systematic Manual Point Count
- ASTM F312- Standard Test Methods for Microscopical Sizing and Counting Particles from Aerospace Fluids on Membrane Filters
Metallographic Case Study Examples
Some examples of metallographic investigations using samples prepared and evaluated at Anderson Materials Evaluation are shown below.
Metallographic Case Study #1: Inclusion Content in Steel – Qualifying Material Lots

The specimen shown in this optical metallographic microscope image was similar to the one shown above in the epoxy potting compound. Each specimen was prepared and evaluated according to the requirements of ASTM Standard E 45, “Standard Test Methods for Determining the Inclusion Content of Steel,” Method A (Worst Fields). In this evaluation a specimen is ground and polished according to selected procedures outlined in ASTM Standard E 3. A visual survey over 160 mm2 (0.25 in.2) of the surface is then performed at 100x in fields that have an area of 0.50 mm2 each. The entire sample is rated by its worst field for a number of different potential inclusions, such as the “Type D Globular Oxide” heavy inclusion indicated by the circle. By comparing the worst fields to preset acceptance criteria, this type of evaluation can be used to qualify bulk material lots before introducing them into manufacturing processes.
Case Study #2: Graphitic Corrosion in Grey Cast Iron – Water Pipe Inspection
These SEM images show cross sections of a grey cast iron water pipe. The cross section surfaces were ground and polished to reveal the continuous network of flake-like graphite peculiar to this form of iron. A grey cast iron pipe that has undergone graphitic corrosion often visually appears to be fine other then some general surface corrosion. However, due to possible subsurface attack a substantial portion of a pipe’s wall thickness can be converted to a weak and brittle graphite network with dramatically reduced mechanical strength. Graphitic corrosion can lead to catastrophic failure in grey cast iron pipes carrying water at relatively high pressures.
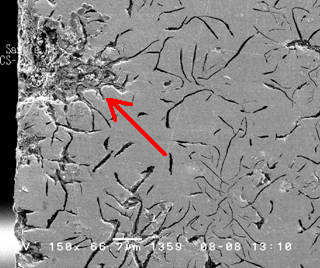
The free surface at the left side of the Figure 1 was the outside surface of the previously buried pipe, which had been in contact with moist soil. A damaged area is plainly visible penetrating the pipe wall from the outer surface at the left. This form of attack, known as graphitic corrosion, is specific to grey cast iron. It occurs when the more noble graphite promotes the accelerated attack of the nearby iron metal through galvanic action in a corrosive environment such as a damp soil.
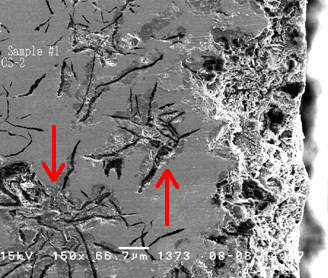
The free surface at the right side of Figure 2 was the inner surface of the same pipe, which had been in contact with potable water. The inner surface clearly suffered corrosive attack resulting in roughening and loss of wall thickness. Additional evidence of graphitic corrosion is visible here. Metal loss due to galvanic attack is obvious around several of the graphite flake clusters visible in this cross section plane. This subsurface damage is possible because of the continuous graphite network and would not have been identified through a surface-based visual inspection.
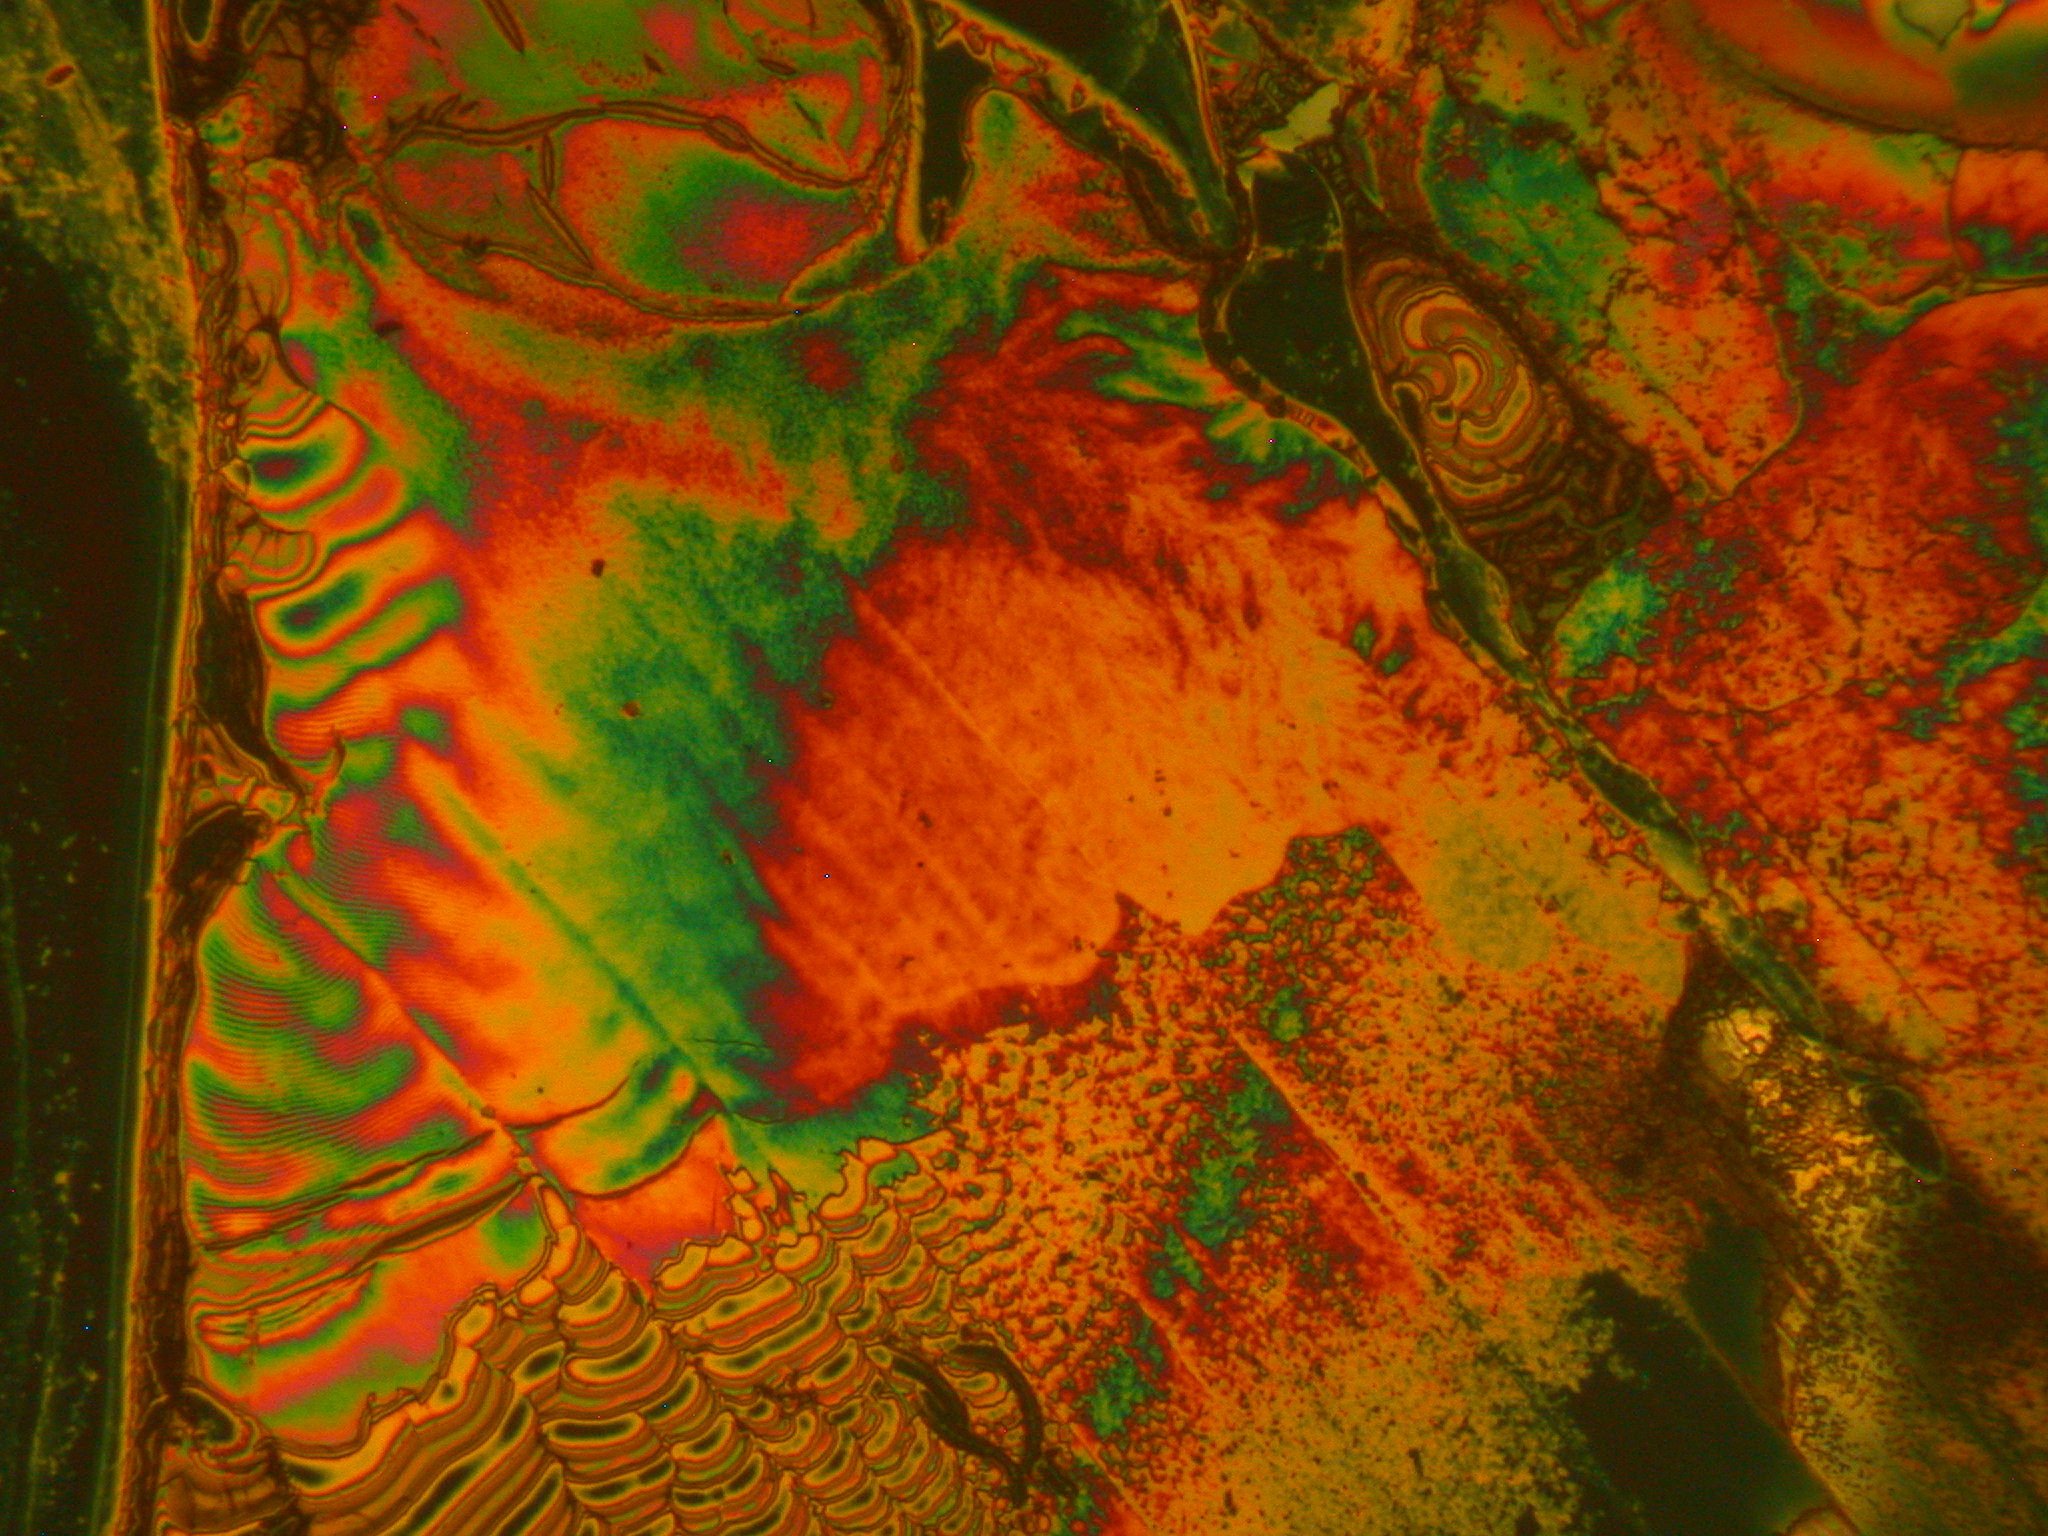
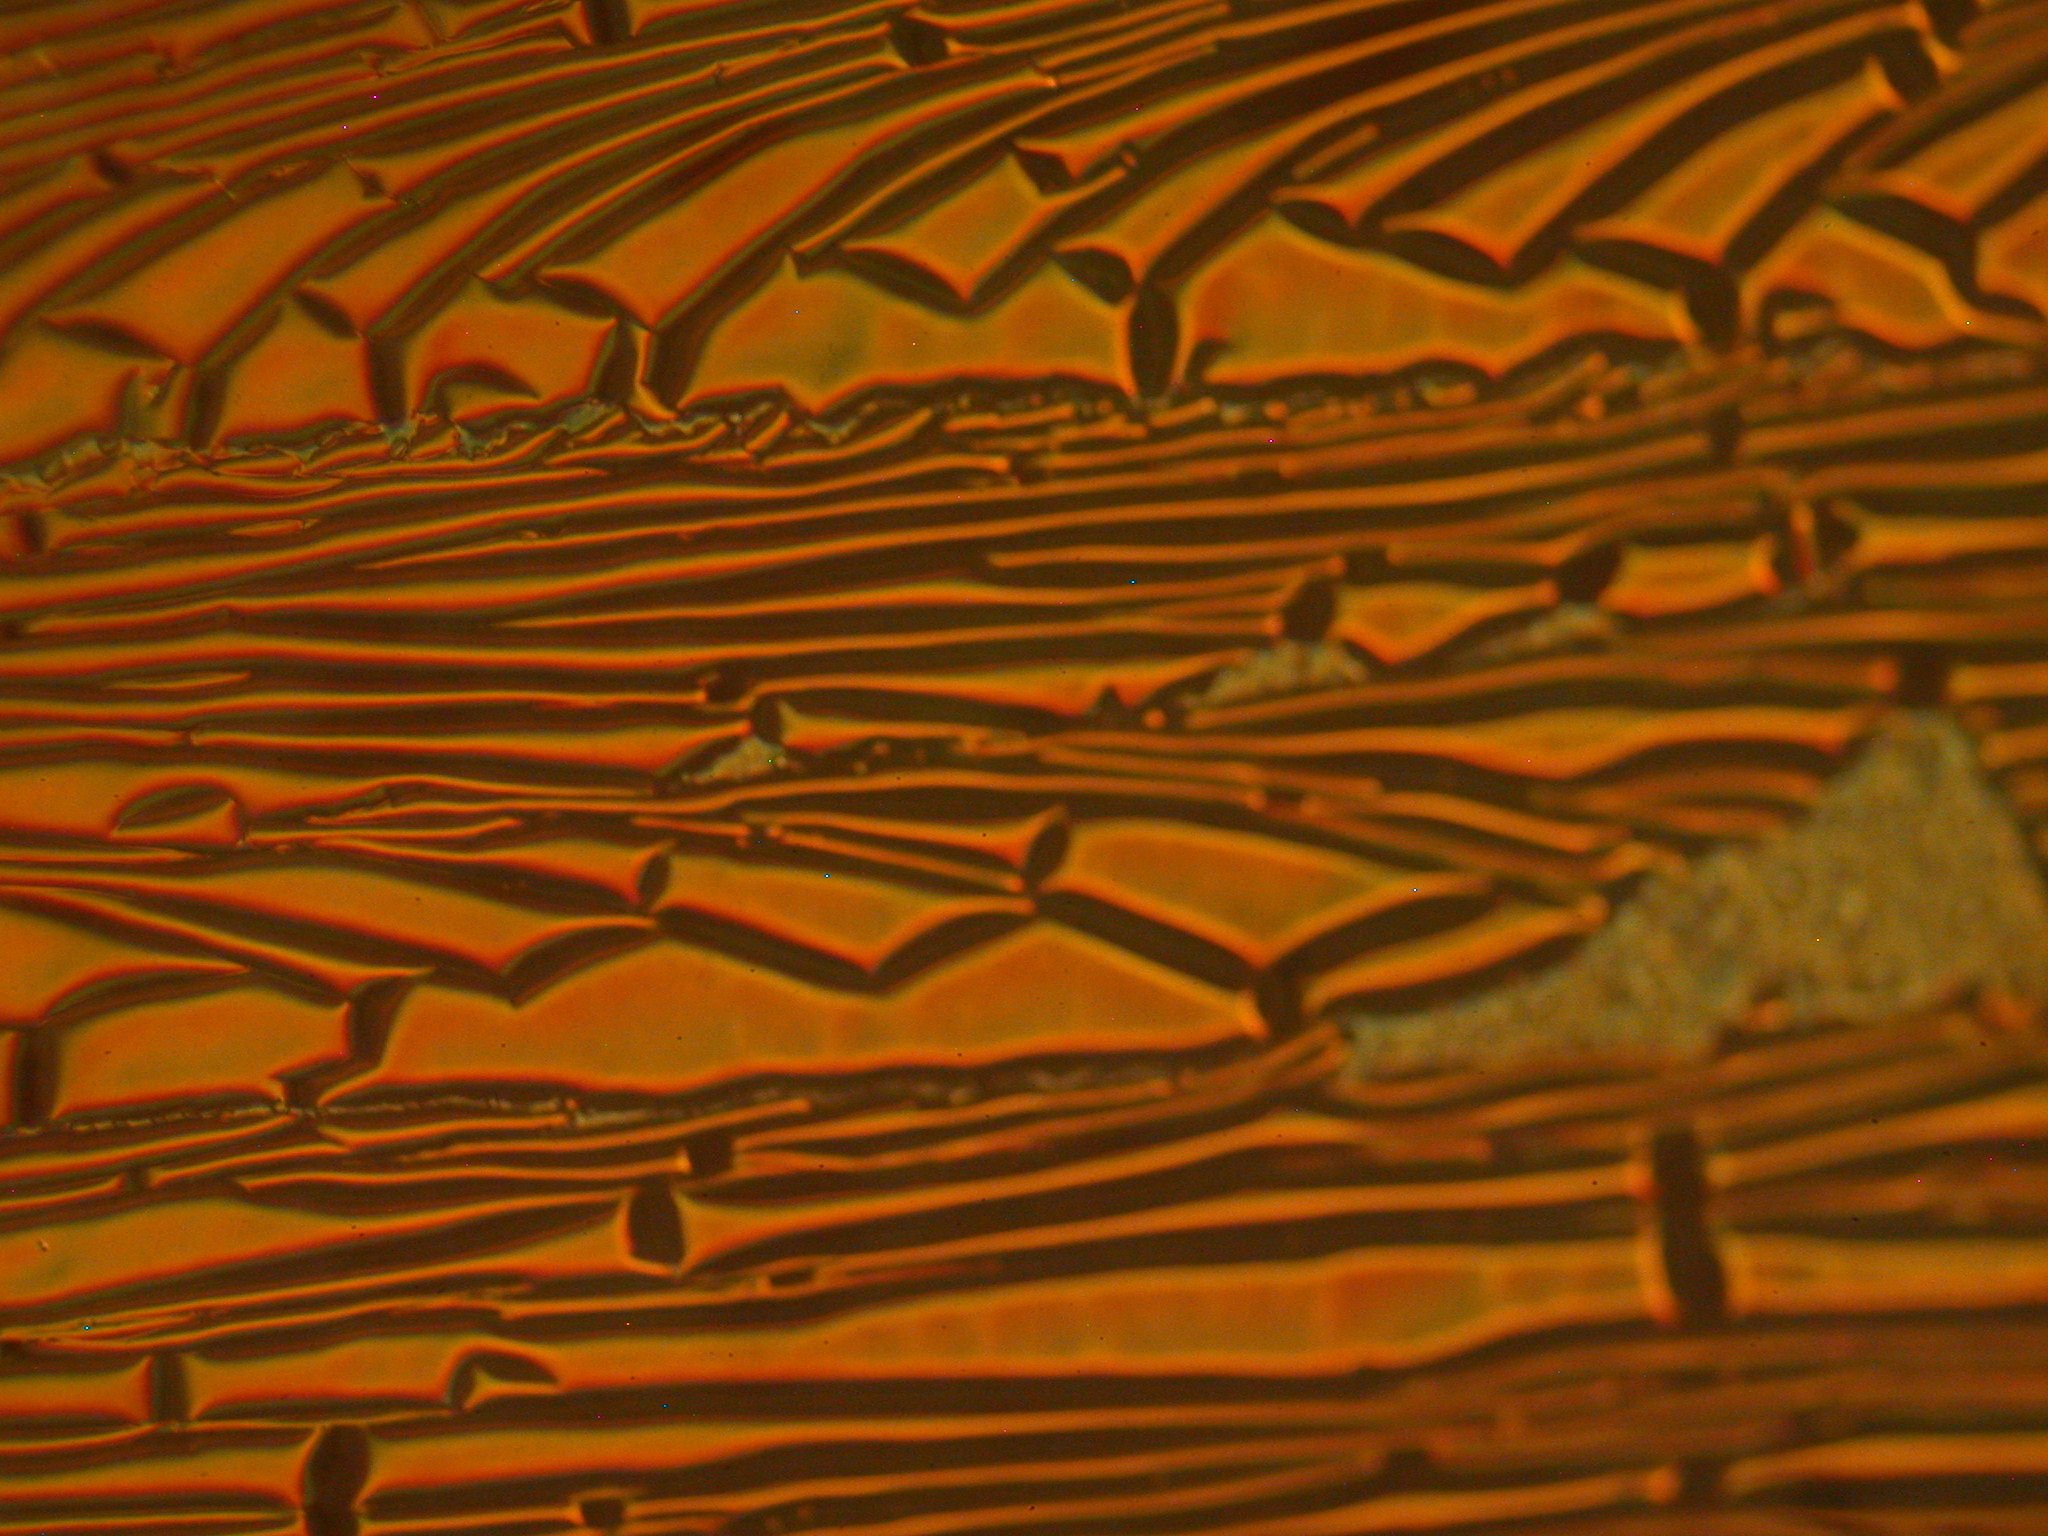
Metallographic Case Study #3: Uses of Nomarski Phase Interference Contrast Microscopy
Use of Nomarski phase interference contrast microscopy capability of the metallographic microscope to indicate areas of damage and subsequent chemical attack or contamination in anti-reflective coatings on optical elements or delamination failures
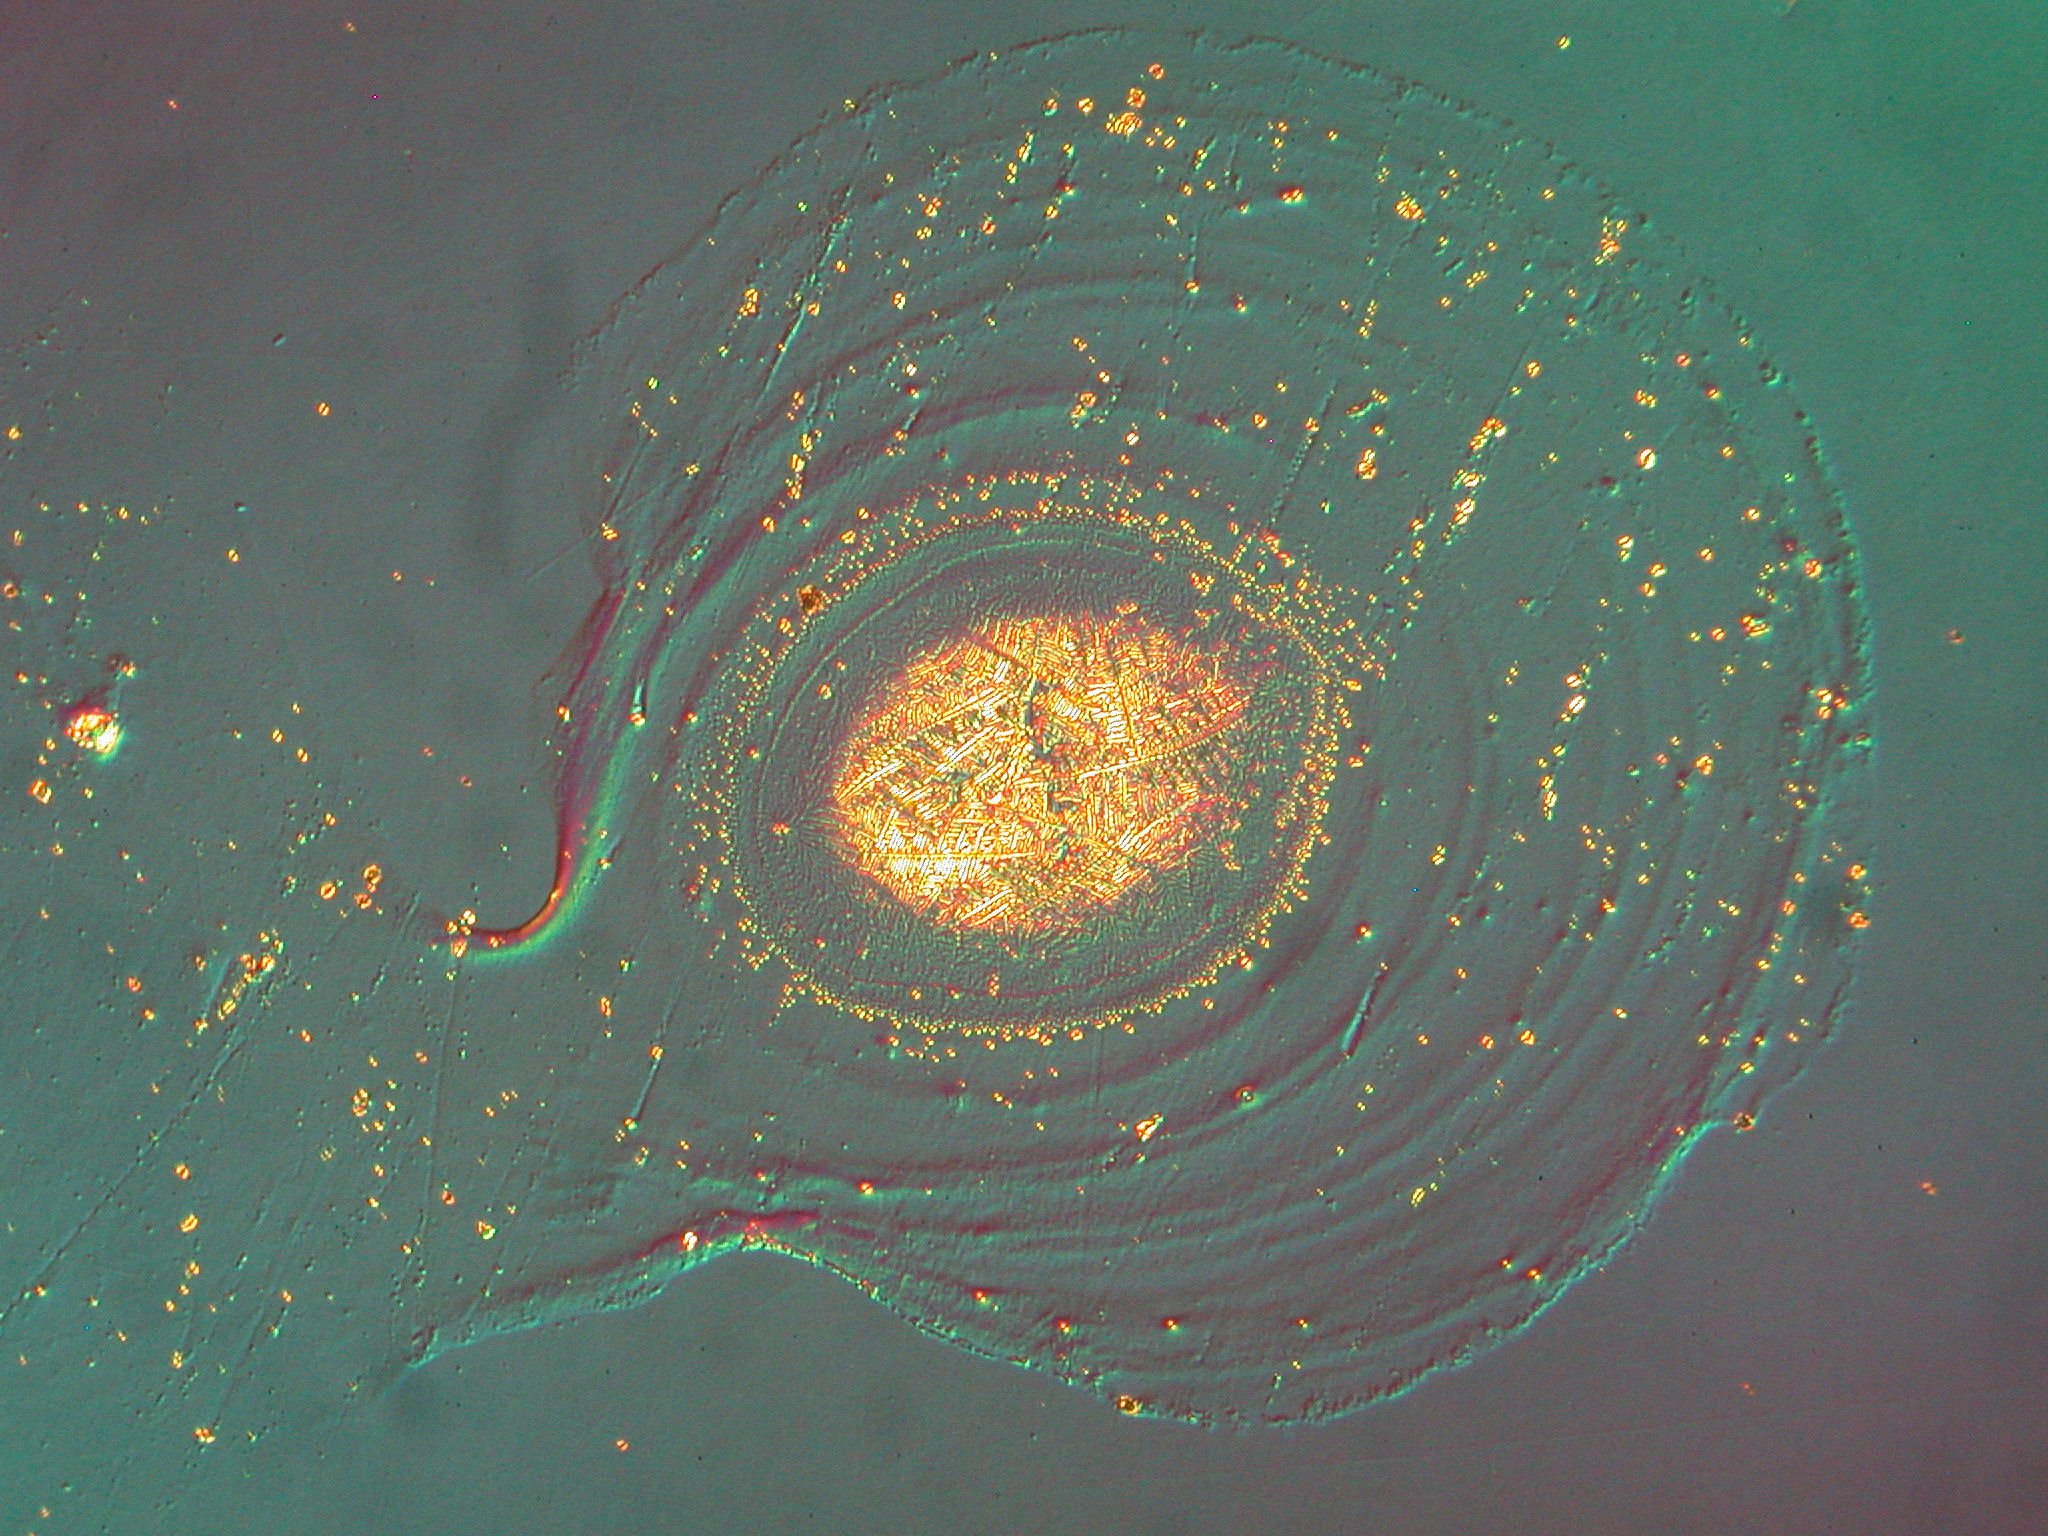
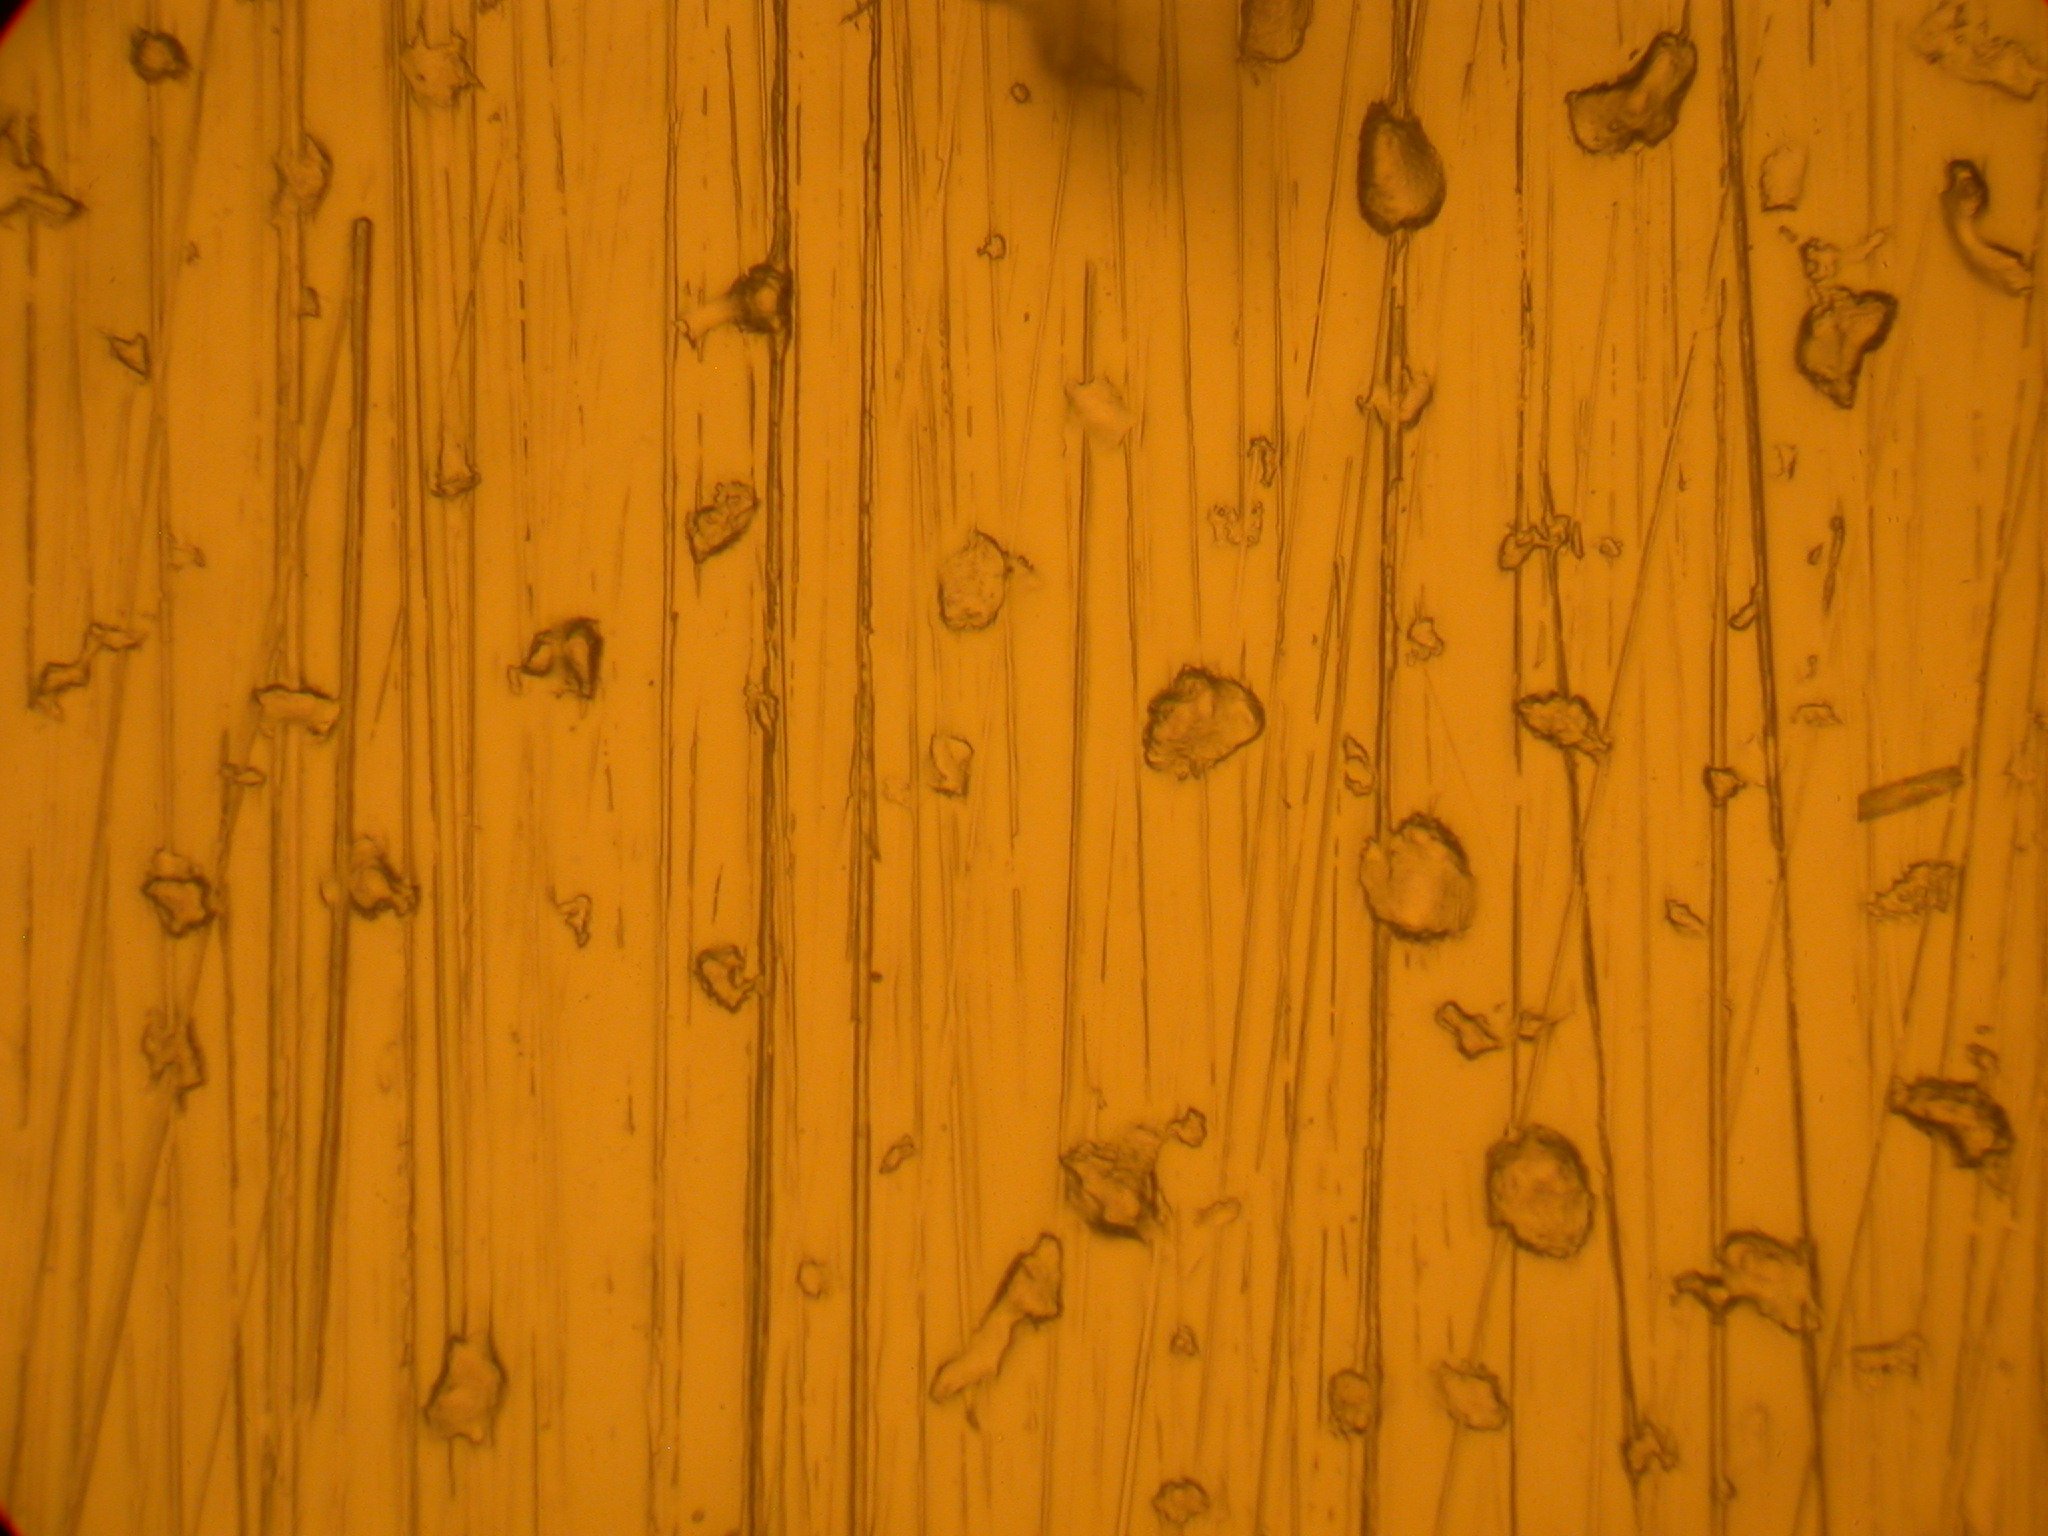
The image above is of a molded clear polymer part surface. This is a high resolution optical image at about 348 times magnification. The “bubbles” are cavities in the surface due to a mold release agent incorporated into the plastic. The lines are due to the replication of abrasion marks in the mold due to abrasively cleaning the mold. This surface is rough enough that with the limited depth of field of the microscope at such high magnification much of the image is not well in focus.
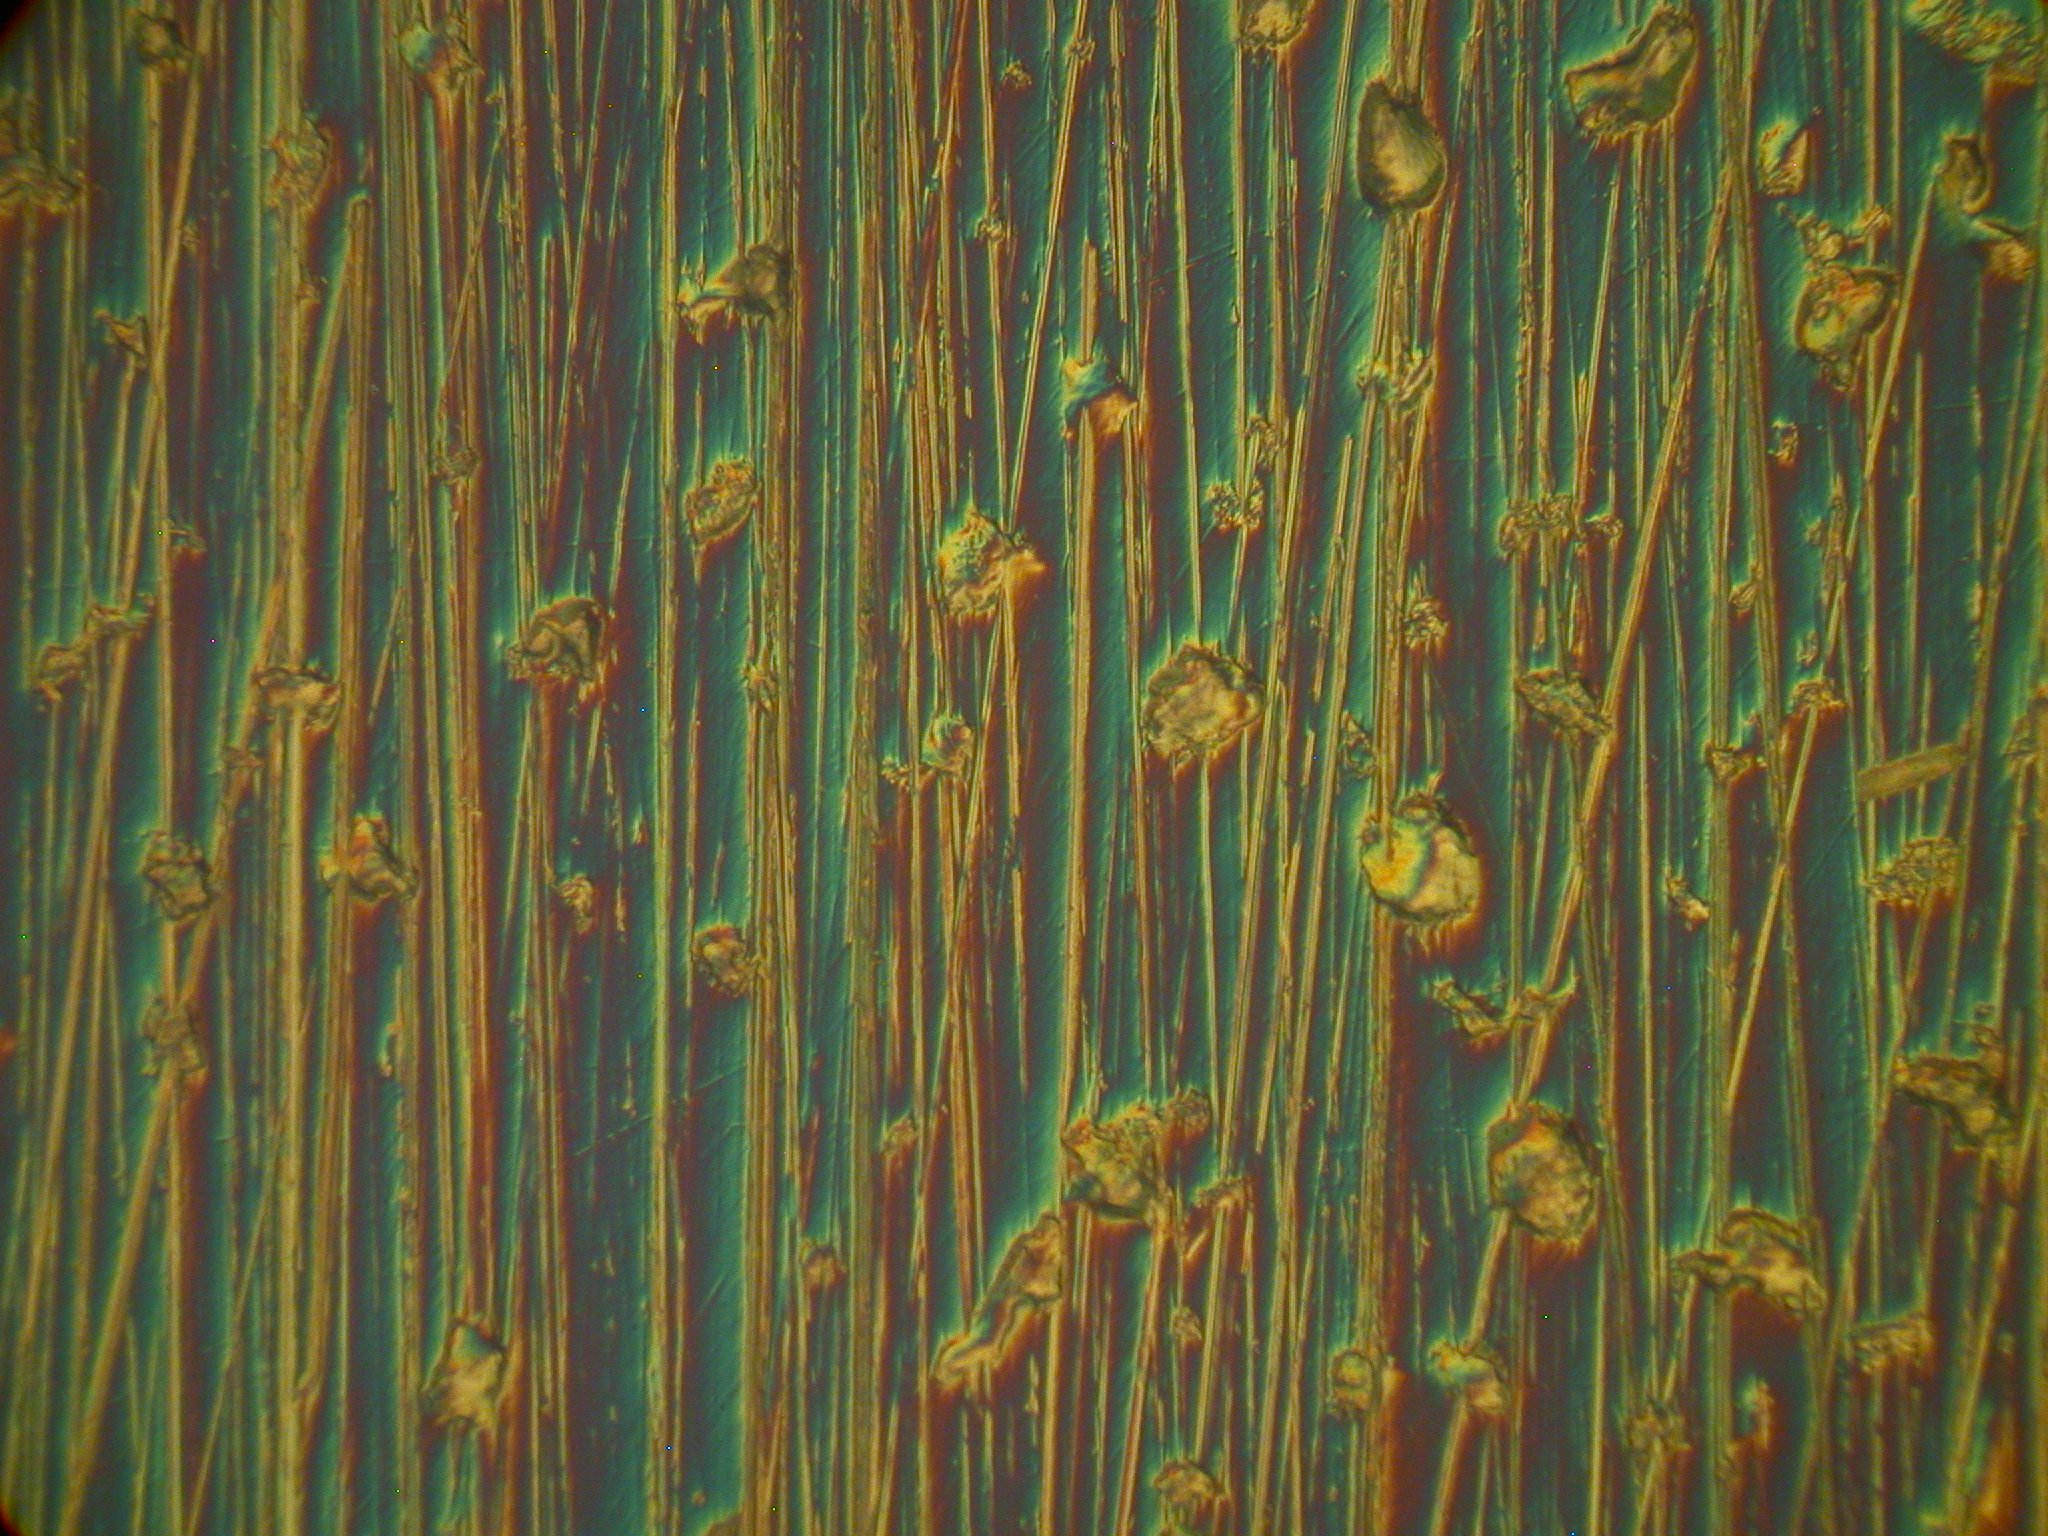
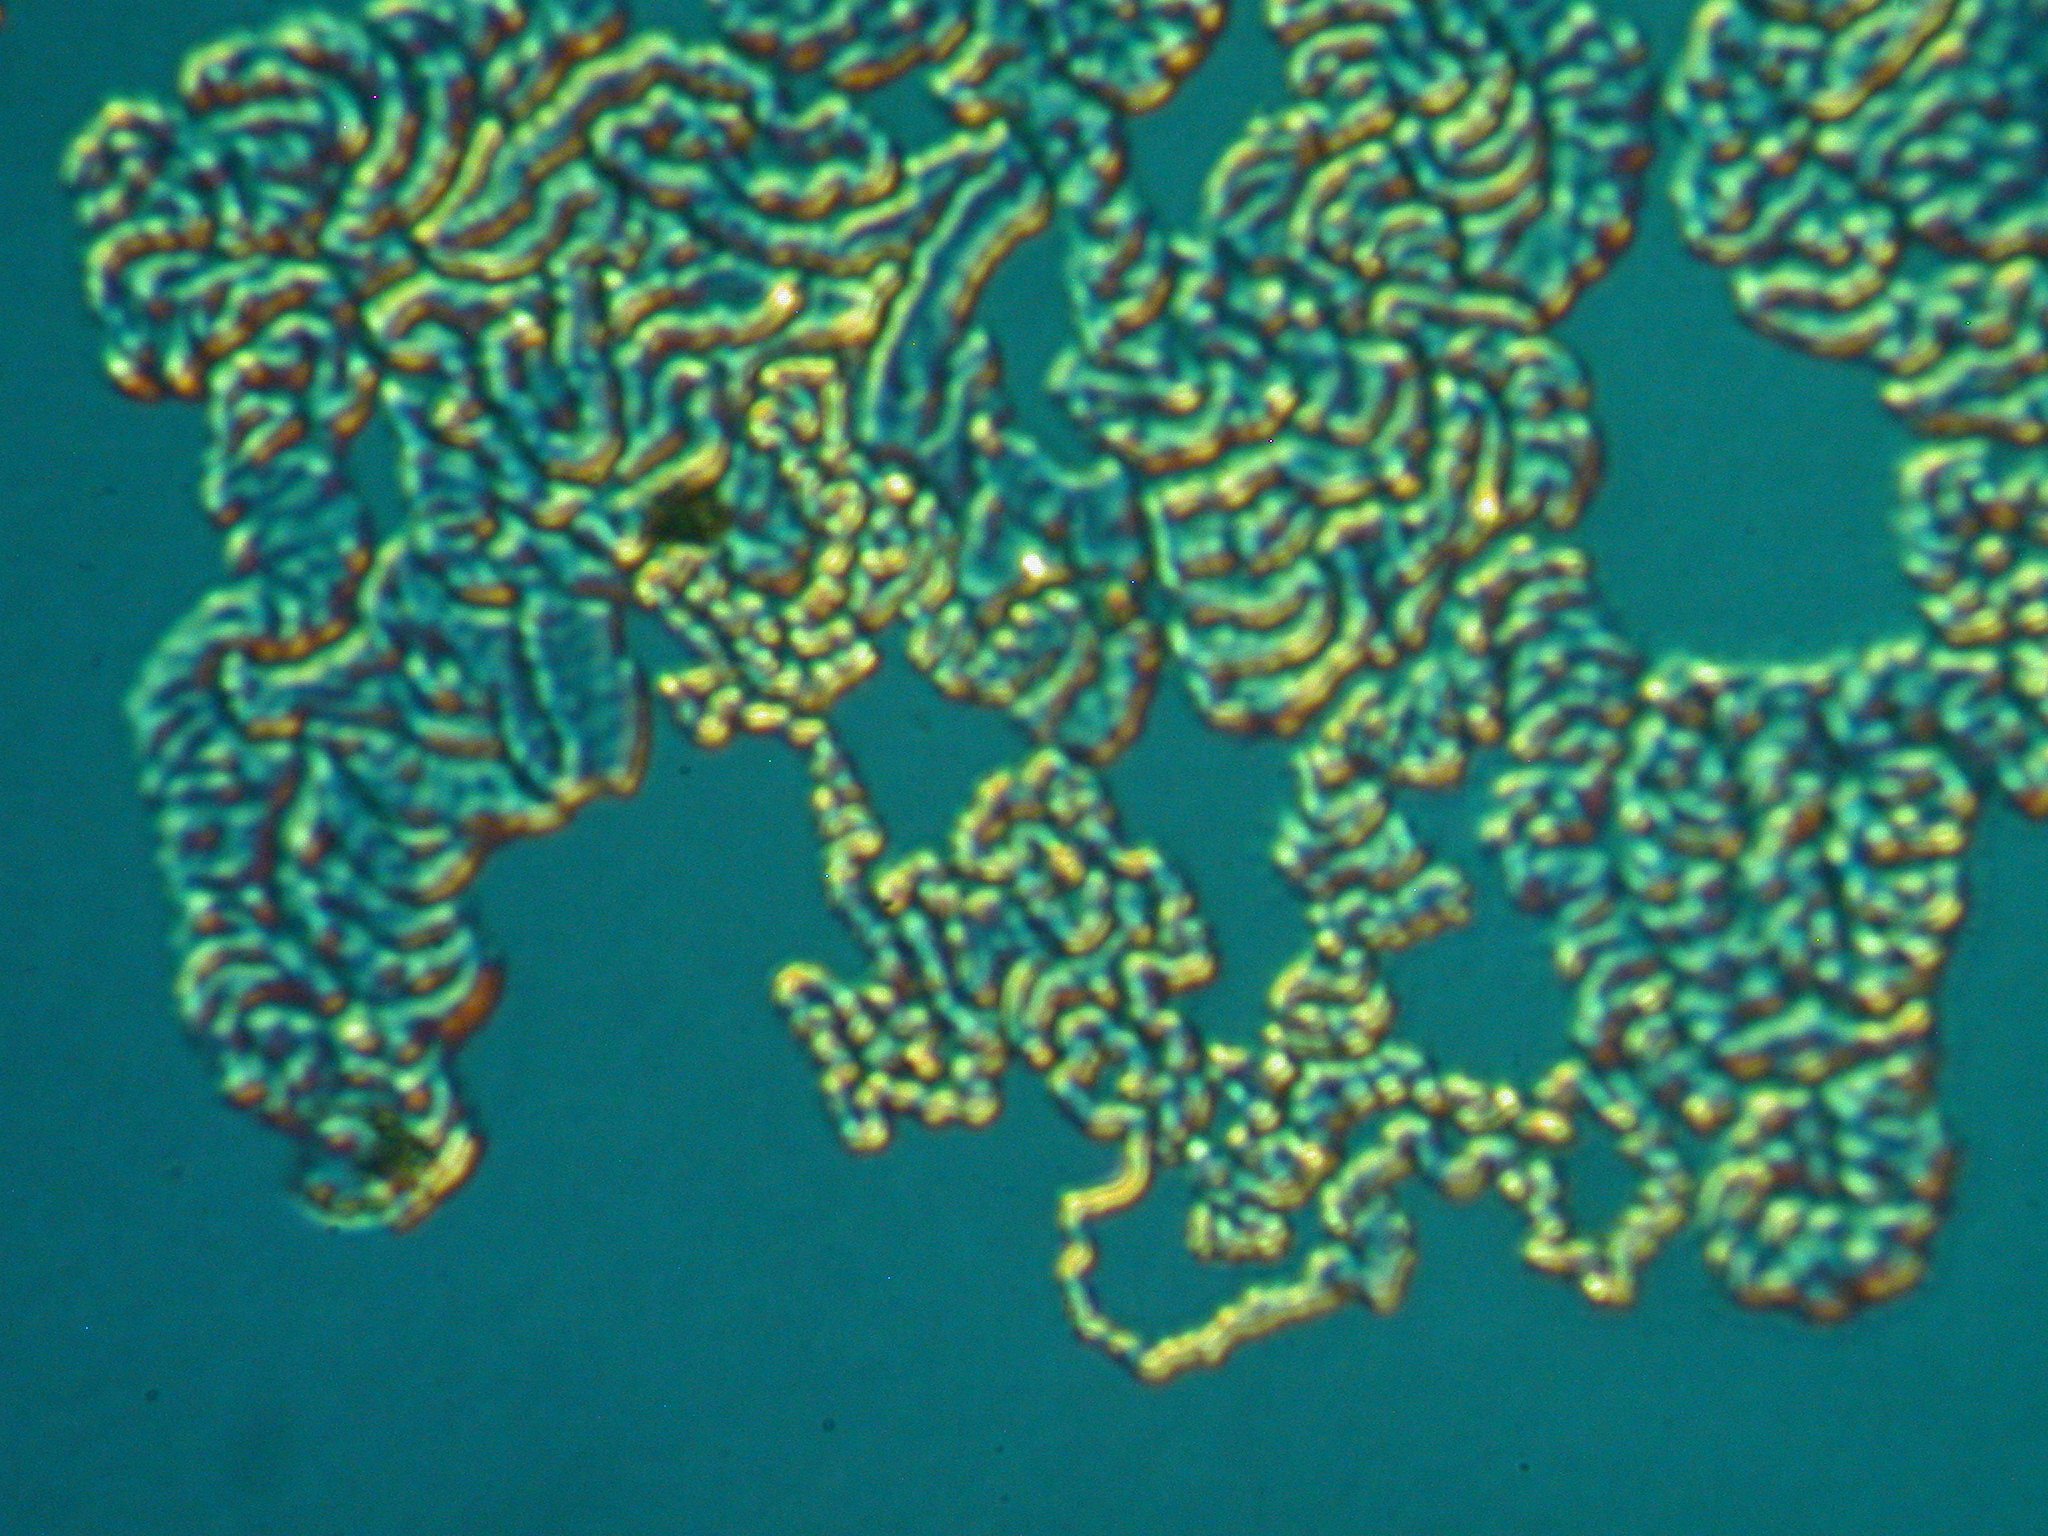
This Nomarski image of the same area of the clear molded polymer part shown in the back-reflection lighting image above it, is in much better focus through all parts of the image. The Nomarski differential interference phase contrast mode increases the depth of field, which can often be distressingly shallow in high resolution optical microscopy. It also allows one to assess which features are depressed or raised and which are at a similar elevation.
An example of the use of electrochemical etching to reveal grain structure in a metallographic sample is shown in Corrosion and Electrochemistry Case Study 1: Evaluating Chemical Plant Intergranular Corrosion with Metallography and XPS Chemical Analysis.
See another example of metallographic microscopy images used to examine
grain size and carbide precipitate number and size in a sensitization investigation of 304 stainless steel using the ASTM G108 Test Method.
Feel free to contact us today to discuss your metallography concerns. We’re happy collaborating with you to devise a customized plan of action that effectively resolves your challenges.