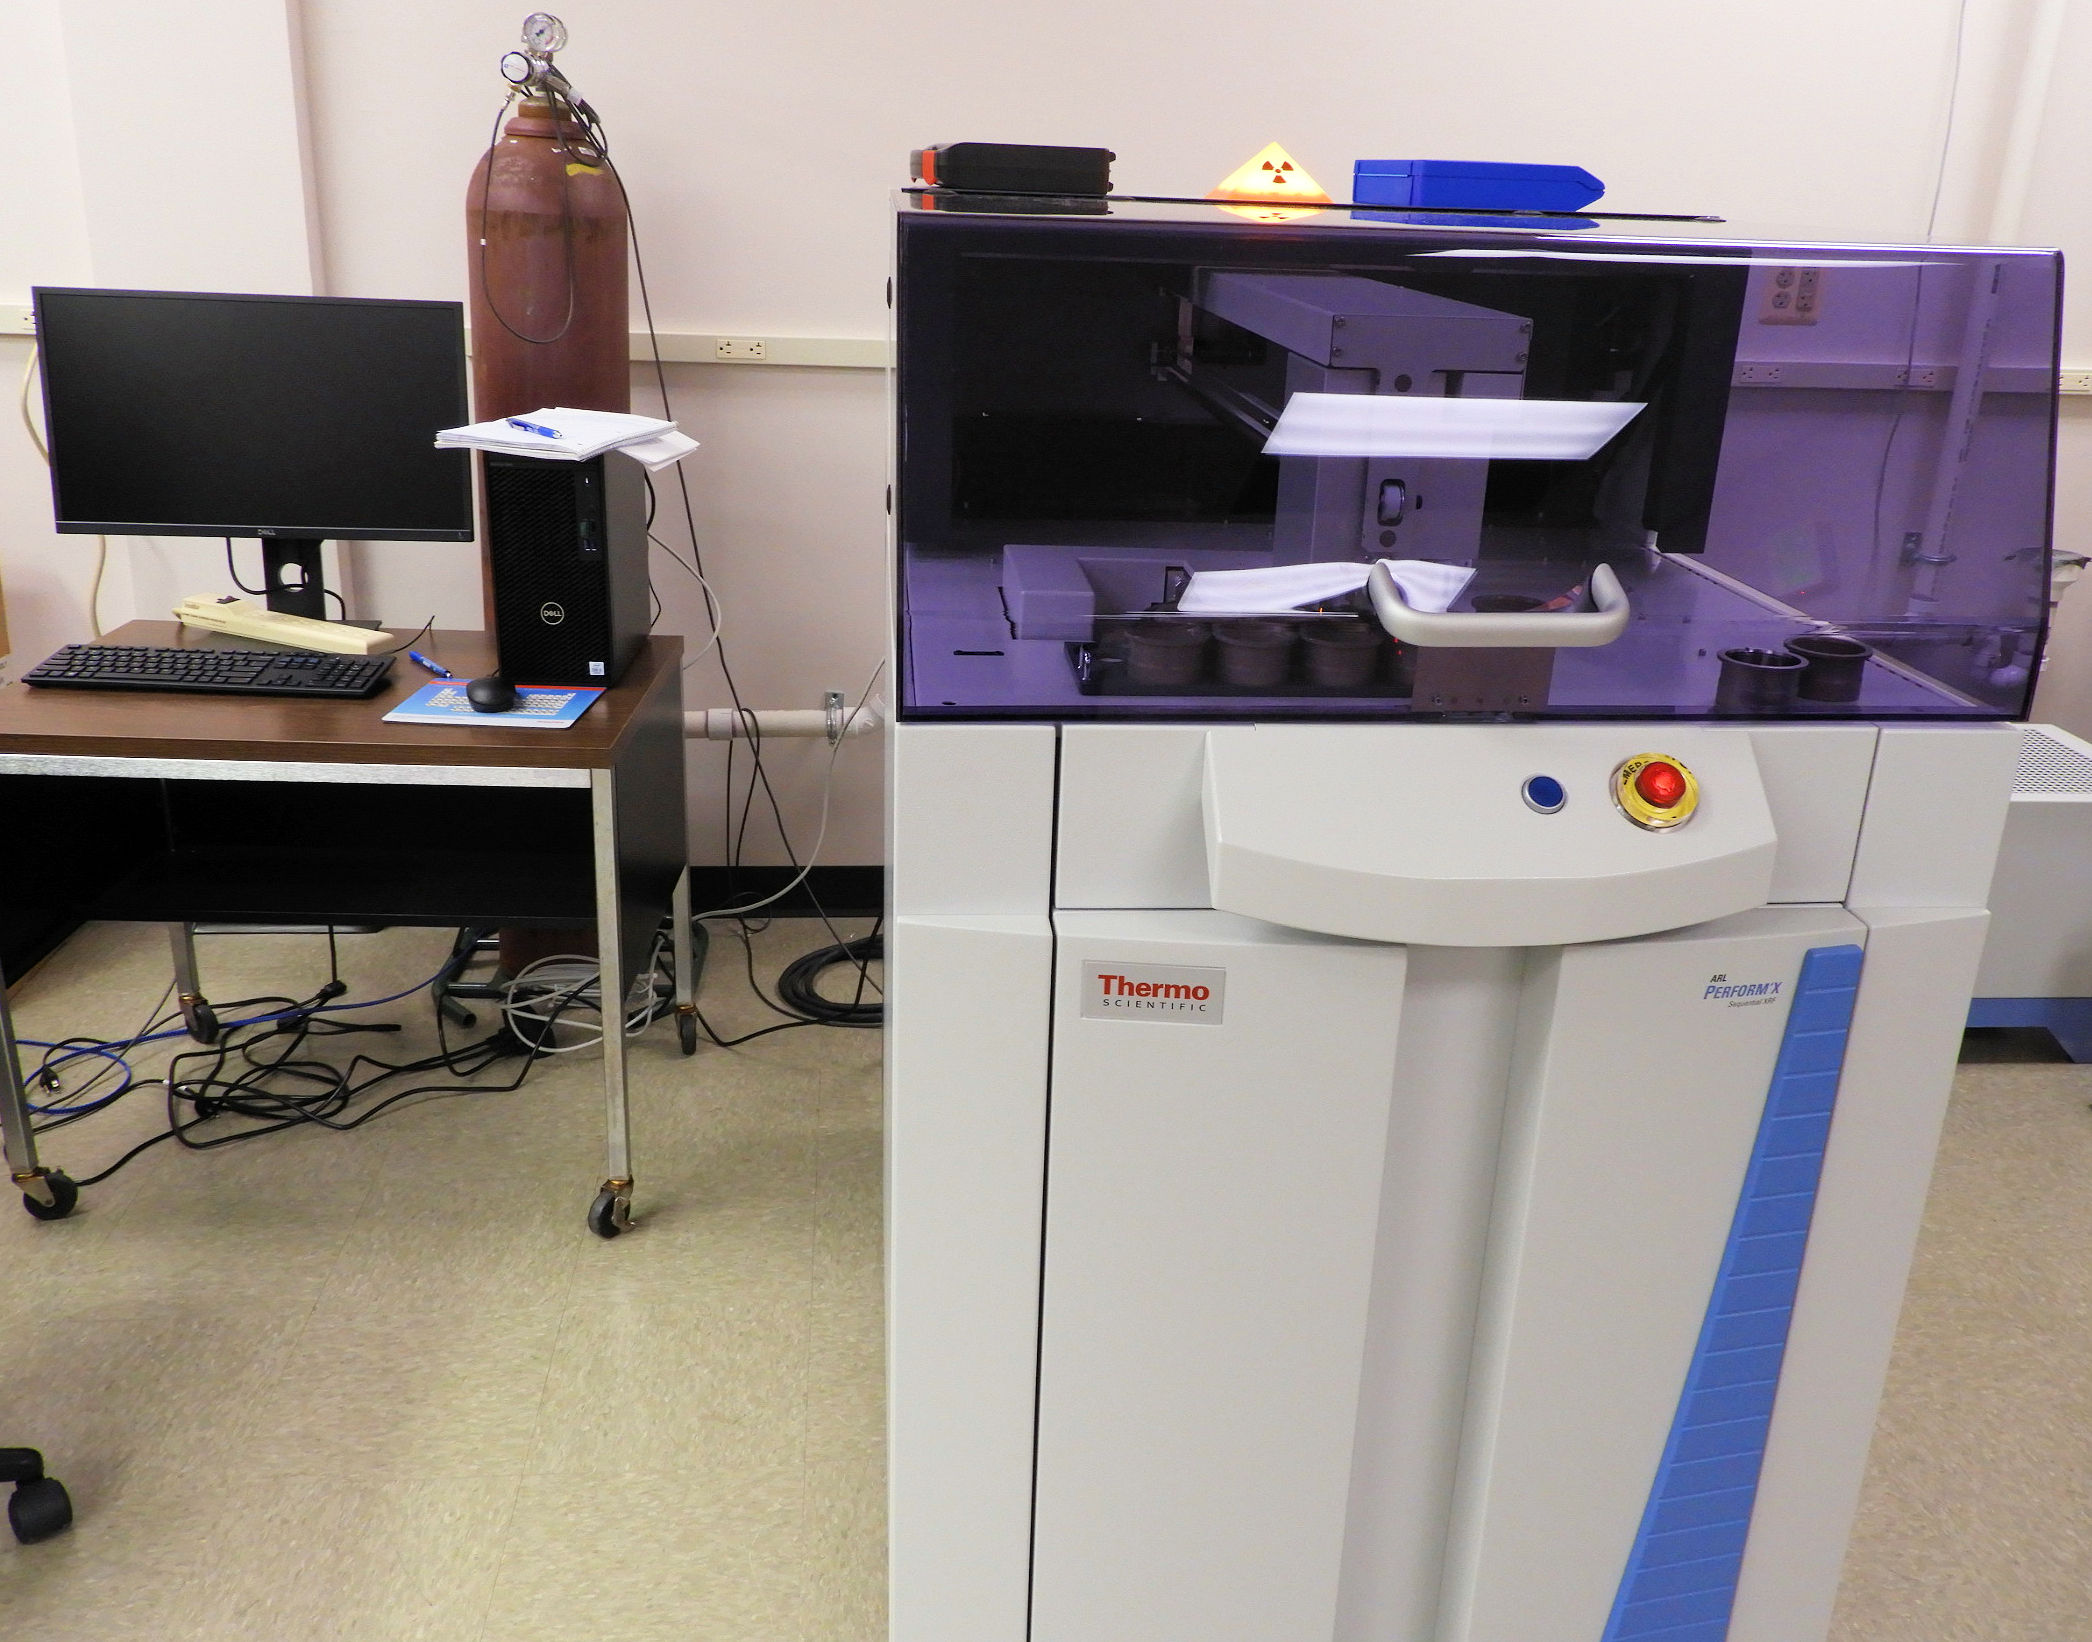
Our 1500W wavelength-dispersive XRF spectrometer with Rh x-ray (Rh K-alpha 20.167 KeV) tube quantitatively measures the elemental concentrations for the elements fluorine through uranium to a depth in a material which is commonly 0.02 mm (20 micrometers) to about 1.5 mm deep, depending upon the density of the material and the energy of the characteristic x-ray emitted. XRF analysis has very low detection limits for these elements, measuring the lighter elements for concentrations greater than about 0.01 weight percent and the heavier elements to less than 10 ppm by weight. Our spectrometer also has a special crystal which provides analysis for carbon and nitrogen, though its usefulness is limited to low density materials due to the very low energy of the characteristic carbon and nitrogen x-ray emission.
Solid samples, powders, and liquids can be analyzed with XRF testing. The special crystal for quantitatively measuring carbon and nitrogen makes this spectrometer unusually useful for polymer analysis. It also has an unusual small spot capability to compare the relative composition of spots of 0.5 or 1.5 mm diameter. The spectrometer is routinely calibrated for pure Ti, V, Co, Zn, Zr, Mo, Sn, W, Au, and F (Teflon).
The primary mode of analysis uses apertures of either 29 mm or 10 mm for quantitative measurements. Of course, large area measurements offer lower detection limits and greater accuracy of measurement. Ideal sample sizes allow us to use the 29 mm diameter analysis area, with the sample having a diameter between 31 and 52 mm. Our cassettes for solid samples have an inside diameter of 52 mm. The largest square sample that will fit is one with sides of 36.76 mm. Samples that cannot fit within the 52 mm diameter will have to be cut to suitable dimensions. Particle and liquid samples are supported by 6-micron thick polypropylene films over either the 29 or 10 mm apertures. The use of the film means the special carbon and nitrogen crystal detector cannot be used. About 10 milliliters of particles or liquid provide a good sample size, though less can be used if necessary.
XRF analysis is often used to detect low concentrations of heavy metals such as lead, cadmium, mercury, and chromium, as well as hazardous bromine organic compounds sometimes found in plastics. XRF testing is commonly used to identify metal alloys. XRF analysis of oils, lubricants, or diesel fuels measures the sulfur, chlorine, barium, calcium, phosphorus, zinc and wear materials concentrations. Lead and manganese in gasoline are also measured. The analysis of concrete by XRF is another key application of XRF testing. Glass, ceramic, mineral, catalyst, and soil sediment materials are readily analyzed by XRF testing.
XRF elemental composition analysis is supplemented by our XPS surface analysis, which can detect all elements in a surface except hydrogen and helium. Consequently, XPS analysis supplements XRF analysis when a glass is a borosilicate glass or when a material may have lithium, boron, or beryllium in it. About 90% of the XPS signal comes from the outer 20 nm of the surface. For smaller area analysis, the EDS analysis capability of our SEM provides semi-quantitative elemental analysis to a depth of about 1 micrometer. Our EDS can detect carbon, nitrogen, and oxygen, but not quantitatively. We can also perform quantitative analysis of crystalline chemical phases in a sample using our XRD system.
Alumina Analysis XRF Example
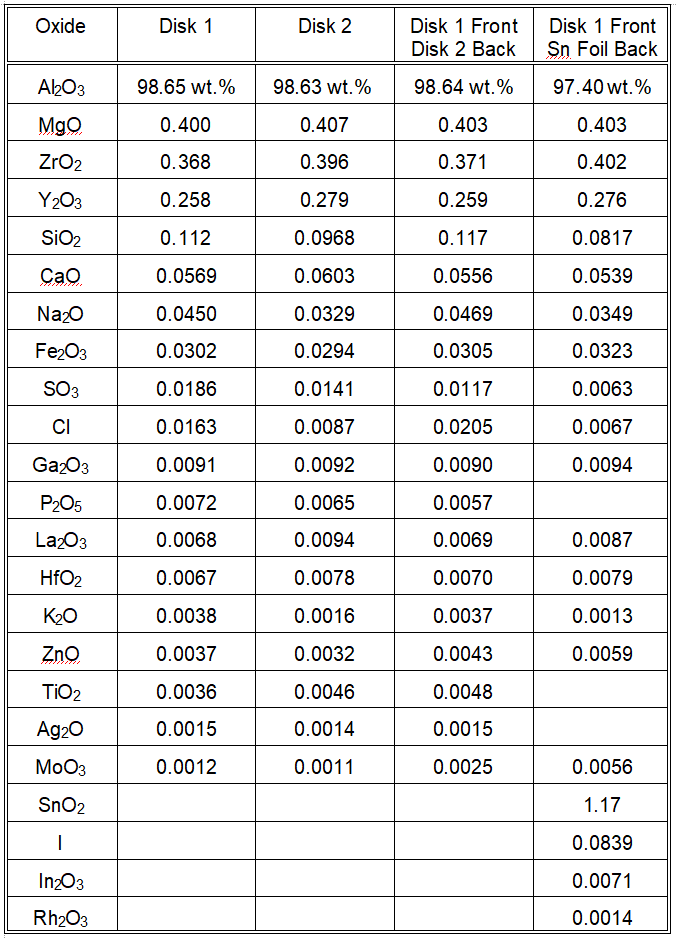
In this example, we will perform oxide weight percent (wt.%) analysis of two alumina disks. These disks are from the same supplier and are 40 mm in diameter and 2 mm thick. The specific gravity of the disks was 3.80. The analysis area is 29 mm in diameter. Each disk was analyzed alone. Note that the oxide compositions of Disk 1 and Disk 2 are very similar. The analysis provides an estimated error for each oxide quantity and those errors overlap for every oxide weight percent going down the list until one reaches Na2O at around 0.04 wt.%. At such a low concentration, such a difference between the two alumina disks may be due to a real difference in the distribution of rare particles that had sodium in them that were then sintered to form the ceramic alumina. Such differences between the two disks continue with a good proportion of the remaining lower concentration oxides.
It was observed that the discoloration caused by the x-ray irradiation resulted in no weight-loss in each disk, but did extend fully to the back side of the disk. Consequently, heavy elements deeper than 2 mm into the alumina might contribute to the detected x-ray signals. We wanted to know how well the analysis program handled the composition analysis when the sample was substantially thicker given that the ratio of heavy element x-ray signal to lighter element x-ray signal would increase. This caused us to put Disk 2 behind Disk 1 and do the analysis again to see if the composition results were consistent for a sample 4 mm thick compared to one 2 mm thick. The results are given in the table below. The results are very consistent with those of the two individual alumina ceramic disks.
This could be because, while the excitation x-ray was clearly reaching into Disk 2 even when it was behind Disk 1 due to the observation of further x-ray induced discoloration, perhaps none of the excited x-ray emission radiation was able to penetrate the front disk and be detected at the detector. To test this, we put a foil of tin behind the alumina Disk 1 and performed the analysis again. The tin foil, 0.05mm thick, had been previously analyzed and was found to be 97.33 wt.% tin and 2.38 wt.% iodine. Iodine is a slightly heavier element than tin. Molybdenum was the only other element with a concentration greater than 0.1 wt.% in the tin foil. Examine the last column in the table below and you will see that the tin foil at the back of the alumina disk caused the analysis to conclude there was 1.17 wt.% tin oxide in the alumina, so tin x-ray signal was definitely able to pass through the alumina disk and return to the detector. Even the iodine was now detected and the molybdenum oxide concentration increased as well. A relatively low density material, such as aluminum oxide, will be analyzed to depths more than 2 mm deep.
Case Histories and Applications of XRF
Defective Ceramic Floor Tile Glaze
Lead in a Ceramic Dinner Plate – Evaluating the Safety Hazard with XRF and XPS Analysis
Purity of a Calcium Carbonate Sample
Mineral Composition Analysis by XRF and XRD
Wood Preservative Analysis of Disintegrating Wood
ASTM Standard Test Methods
ASTM A754 Standard Test Method for Coating Weight [Mass] of Metallic Coatings on Steel by X-Ray Fluorescence
ASTM B890 Standard Test Method for Determination of Metallic Constituents of Tungsten Alloys and Tungsten Hardmetals by X-Ray Fluorescence Spectrometry
ASTM C1254 Standard Test Method for Determination of Uranium in Mineral Acids by X-Ray Fluorescence
ASTM C1343 Standard Test Method for Determination of Low Concentrations of Uranium in Oils and Organic Liquids by X-ray Fluorescence
ASTM C1456 Standard Test Method for Determination of Uranium or Gadolinium (or both) in Gadolinium Oxide-Uranium Oxide Pellets by X-Ray Fluorescence (XRF)
ASTM C1508 Standard Test Method for Determination of Bromine and Chlorine in UF6 and Uranyl Nitrate by X-Ray Fluorescence (XRF) Spectroscopy
ASTM D2622 Standard Test Method for Sulfur in Petroleum Products by Wavelength Dispersive X-ray Fluorescence Spectrometry
ASTM D4927 Standard Test Method for Elemental Analysis of Lubricant and Additive Components – Barium, Calcium, Phosphorus, Sulfur, and Zinc by Wavelength-Dispersive X-Ray Fluorescence Spectroscopy
ASTM D5059 Standard Test Method for Lead and Manganese in Gasoline by X-Ray Fluorescence Spectroscopy
ASTM D5723 Standard Practice for Determination of Chromium Treatment Weight on Metal Substrates by X-Ray Fluorescence
ASTM D6247 Standard Test Method for Determination of Elemental Content of Polyolefins by Wavelength Dispersive X-ray Fluorescence Spectrometry
ASTM D6906 Standard Test Method of Titanium Treatment Weight on Metal Substrates by Wavelength Dispersive X-Ray Fluorescence
ASTM D7039 Standard Test Method for Sulfur in Gasoline, Diesel Fuel, Jet Fuel, Kerosine, Biodiesel, Biodiesel Blends, and Gasoline-Ethanol Blends by Monochromatic Wavelength Dispersive X-ray Fluorescence Spectrometry
ASTM D7085 Standard Guide for Determination of Chemical Elements in Fluid Catalytic Cracking Catalysts by X-ray Fluorescence Spectrometry (XRF)
ASTM D7343 Standard Practice for Optimization, Sample Handling, Calibration, and Validation of X-ray Fluorescence Spectrometry Methods for Elemental Analysis of Petroleum Products and Lubricants
ASTM D7536 Standard Test Method for Chlorine in Aromatics by Monochromatic Wavelength Dispersive X-ray Fluorescence Spectrometry
ASTM D8127 Standard Test Method for Coupled Particulate and Elemental Analysis using X-ray Fluorescence (XRF) for In-Service Lubricants
ASTM D8252 Standard Test Method for Vanadium and Nickel in Crude and Residual Oil by X-ray Spectrometry