
Overview
Anderson Materials Evaluation (AME) received wood samples from a disintegrating bridge. Our task was to determine if these samples had been treated with a preservative. Many wood preservatives contain copper compounds, so our primary focus was to detect copper using X-ray Fluorescence (XRF). For comparison, we used a known pressure-treated wood sample and a cedar sample that was expected to be untreated.
Findings
- The disintegrating wood had copper levels similar to the pressure-treated wood.
- The cedar sample showed no detectable copper.
- The disintegrating wood also had a high silicon content.
Below is a summary of the analysis report, with all client information removed.
Wood Preservative Analysis Summary
Our analysis involved three types of wood: disintegrating Douglas fir lumber from a bridge, untreated cedar wood, and known preservative-treated wood. Using XRF, we analyzed their elemental composition, focusing on elements like carbon, nitrogen, fluorine, sodium, magnesium, aluminum, silicon, and heavier elements. Our primary goal was to check for copper, a common component in non-organic wood preservatives. Although we focus mainly on copper, we can often visually identify organic preservatives like creosote.
Key Findings:
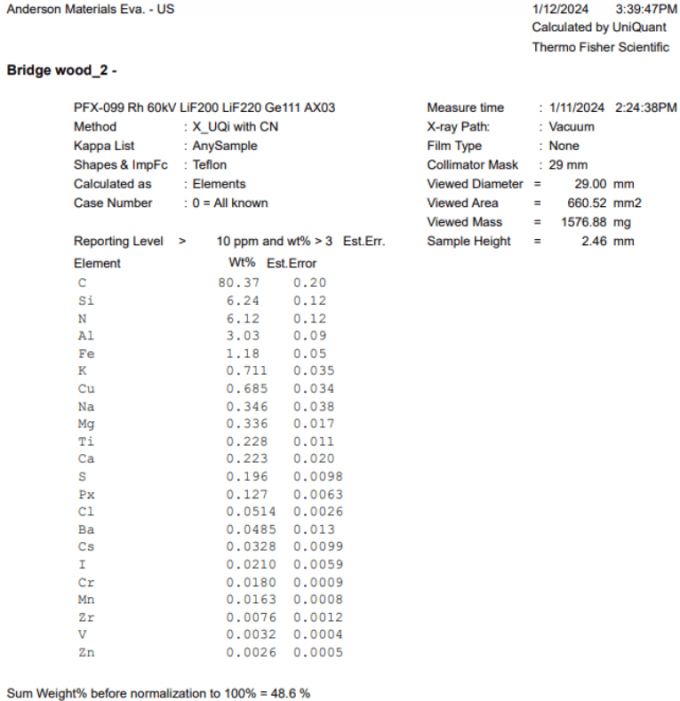
- Two bridge lumber pieces contained ~0.29 wt% Cu and ~0.69 wt% Cu, respectively.
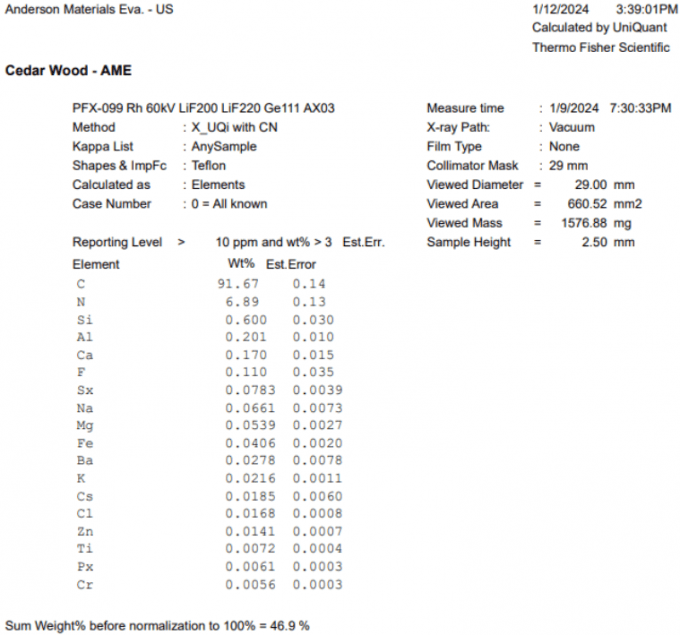
- The cedar wood, assumed to be untreated, had no detectable copper.
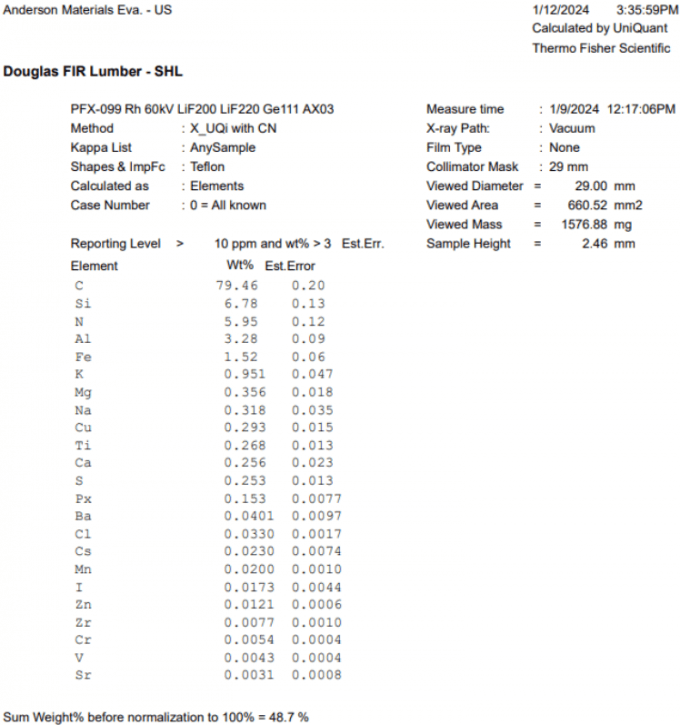
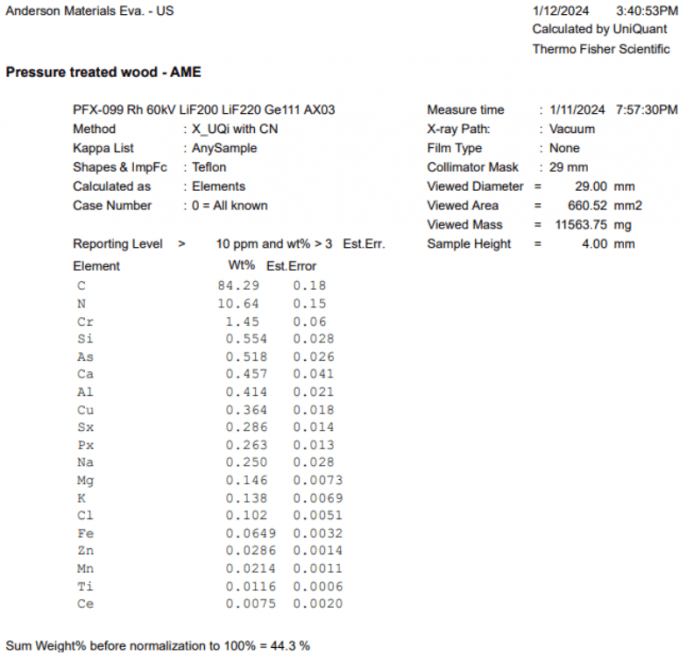
- The known pressure-treated wood had ~0.36 wt% Cu.
Our analysis suggests that the bridge lumber is likely pressure-treated. Additionally, both bridge samples exhibited high silicon (Si) concentrations, ten times higher than our reference samples.
Samples and Background
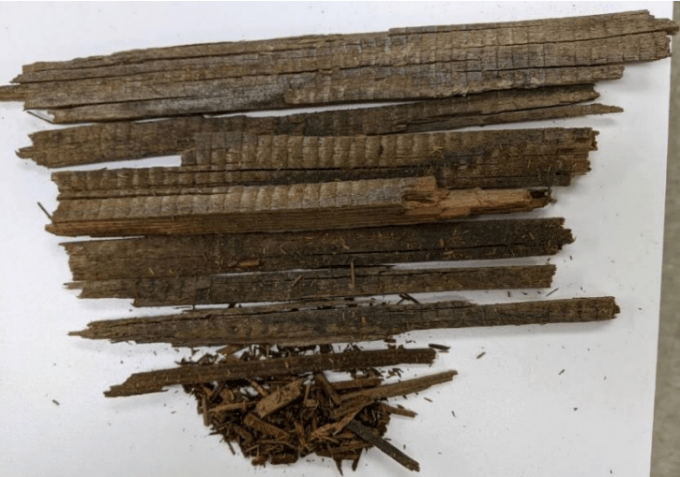
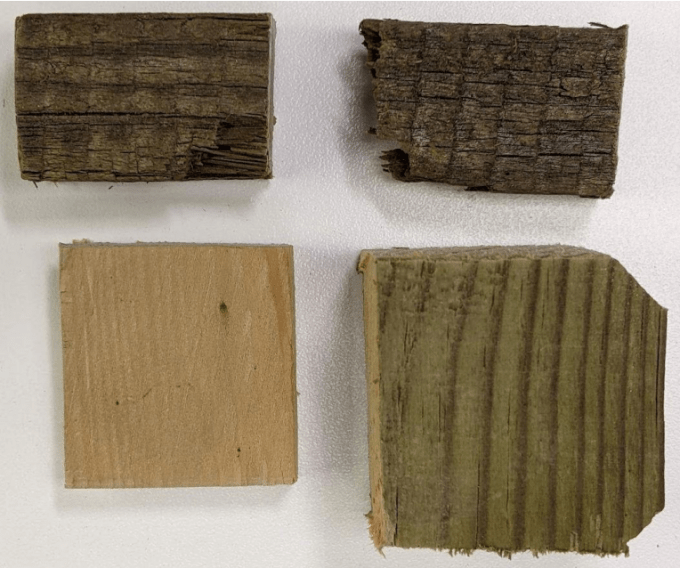
We received wood samples from the rotting bridge for preservative analysis. Figure 1 shows the wood samples received for analysis. In Figure 2, you can see the samples actually analyzed by XRF, with the surfaces facing the x-ray source and detector.
Our analysis included three types of wood: disintegrating Douglas fir lumber from the bridge, untreated cedar wood, and known preservative-treated wood. We aimed to find out whether the wood had a copper-based preservative treatment. Since many wood preservatives contain copper, we focused on this element. Organic preservatives like creosote can often be identified visually.
- Two bridge lumber pieces had ~0.29 wt% Cu and ~0.69 wt% Cu, respectively.
- The cedar wood, assumed to be untreated, showed no detectable copper.
- The known pressure-treated wood had ~0.36 wt% Cu.
These results indicate that the bridge lumber likely underwent copper-based pressure treatment. Furthermore, both bridge samples exhibited high silicon (Si) concentrations, ten times greater than our reference samples.
XRF Spectrometry Analysis
XRF Analysis Capabilities
Our wavelength-dispersive XRF spectrometer measures elemental concentrations from fluorine through uranium. We can also detect carbon and nitrogen using an additional crystal when analyzing low-density materials like polymers. The analysis depth varies based on x-ray energy and material density, ranging from a micrometer to a millimeter. XRF analysis offers low detection limits for elements, and wavelength-dispersive systems provide greater sensitivity and higher energy resolution than less expensive systems. We can detect almost all elements at concentrations as low as 10 ppm. XRF can analyze solid samples, powders, and liquids. Our spectrometer has a small spot capability to measure spots of 0.5 or 1.5 mm in diameter and can measure areas of 10 mm and 29 mm. Larger area measurements offer lower detection limits and greater accuracy. We used a 29 mm aperture for this work and samples were analyzed in a vacuum.
XRF Analysis Results
Figures 3-6 show the elemental composition of lumber from the bridge, cedar wood, and pressure-treated wood. The bridge lumber had ~0.29 wt% and ~0.69 wt% copper (Cu), respectively. The cedar wood showed no Cu, while the pressure-treated wood had ~0.36 wt% Cu. These results indicate that the bridge lumber likely had a copper-based preservative treatment.
Interestingly, both disintegrating bridge wood samples exhibited very high silicon (Si) concentrations, ten times greater than the reference samples. This raises a question: what causes such high Si concentration?
Conclusion
The analysis confirmed that the disintegrating bridge wood samples likely underwent copper-based pressure treatment. Their copper levels matched those of known pressure-treated wood, while the untreated cedar showed no copper. Additionally, the bridge samples had unusually high silicon concentrations, leading to further investigation into the cause.
Contact Us
Please contact us today for your wood analysis needs! Our team of experts is ready to assist you with accurate and detailed material evaluations.