
Three small silicon nitride ceramic rods being evaluated for a biomedical device application were analyzed because of appearance differences. This case history example will show that these ceramic rods had very different compositions and by right ought not be called silicon nitride.
Optical Microscopy Examination and LIBS Analysis
The samples were examined with Keyence VHX-7000N Digital Optical Microscope, equipped with an EA-300 Laser-Induced Breakdown Spectroscopy (LIBS) unit.
This digital microscope has lenses providing zoom magnification from 20 to 2000 times with a 4K CMOS image sensor. The sample stage and the lens are motorized. It has the ability to acquire images many distances above the sample and reconstruct an image from the in-focus areas from each of the many images. The resulting images are capable of showing features at higher magnification that one could otherwise only see with an SEM, which has a much greater depth-of-field than does an ordinary high magnification optical microscope. It can image very large areas by automatically making multiple adjacent images and then stitching them together. The microscope has axial through the lens and ring lighting. It can also provide lighting from various angles. Both 2-dimensional and 3-dimensional distance measurements can be made. The instrument can make particle size analyses and grain-size analyses using advanced automatic image analysis. Surface topography profiles and surface roughness measurements can be acquired.
The EA-300 LIBS elemental analyzer focuses pulses from a 355 nm laser beam on an area about 10 micrometers in diameter. The laser beam pulse ionizes material from a surface commonly to a depth of about 5 to 7 micrometers. The de-excitation of the resulting plasma emits characteristic radiation in the deep ultraviolet, visible, and near infrared range (185 – 960 nm wavelength). The emitted light is analyzed through the lens by a 1 by 1.8 inch 3.19-megapixel CMOS image sensor. Each pixel is analyzed over a 16-bit intensity range for the RGB color. The elements in the plasma are identified semi-quantitatively from this intensity and color data. Small areas in a larger sample and small particles of contamination can be elementally analyzed for all the elements, including H, Li, Be, B, C, N, O, F, Na, Mg, Al, Si, P, S, and heavier all the way to U.
Optical Microscopy and LIBS Conclusions
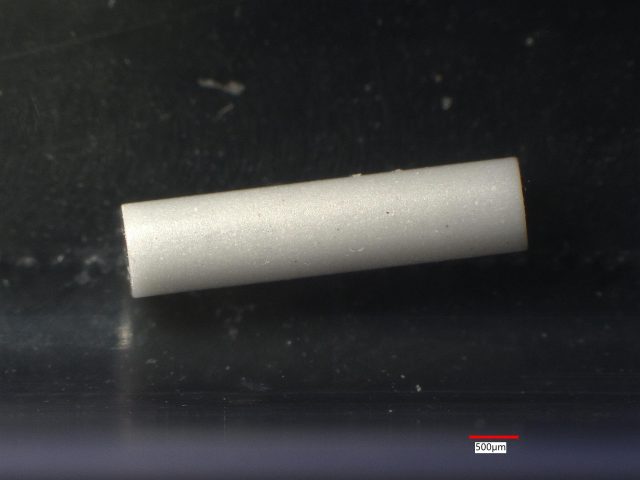
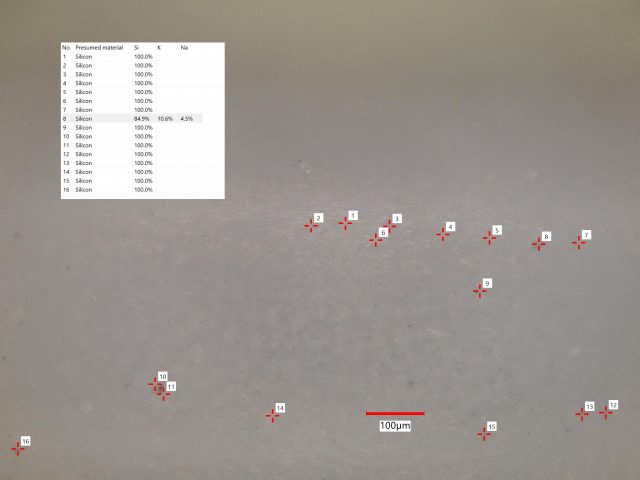
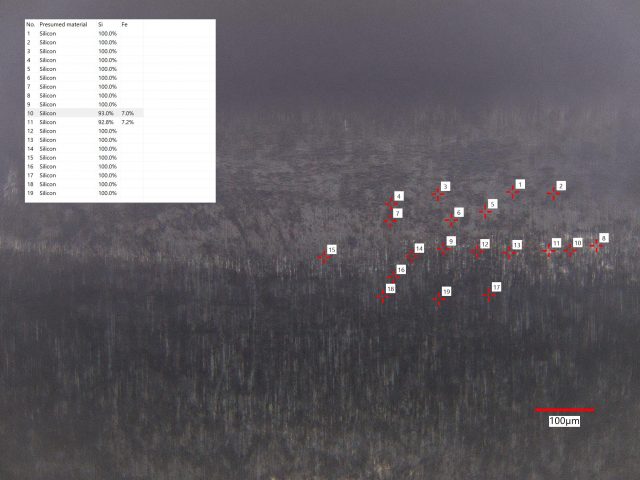
Sample 1: The ceramic is white almost everywhere with only a few small black spots. LIBS detected only Si at 26 of 27 sites. K and Na were detected at one site in addition to Si.
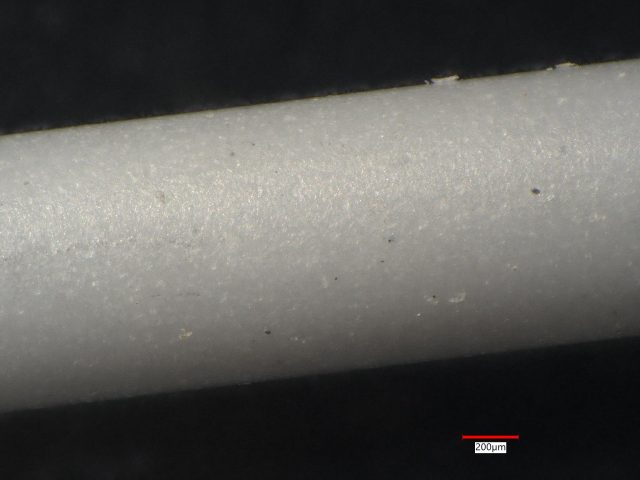
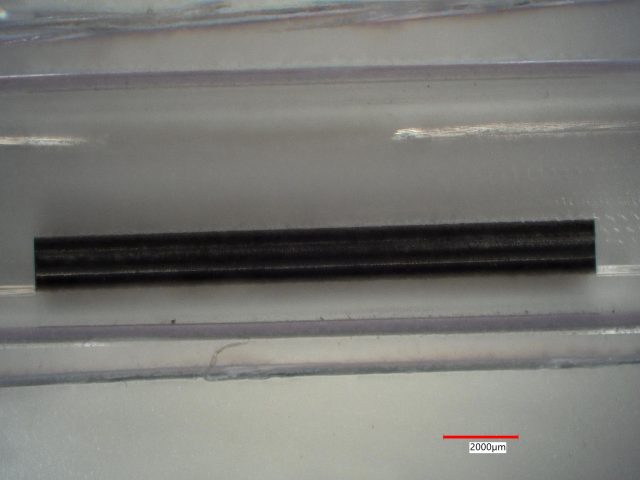
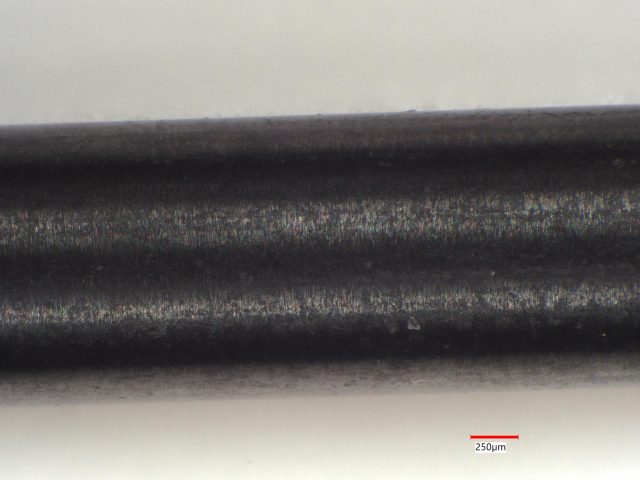
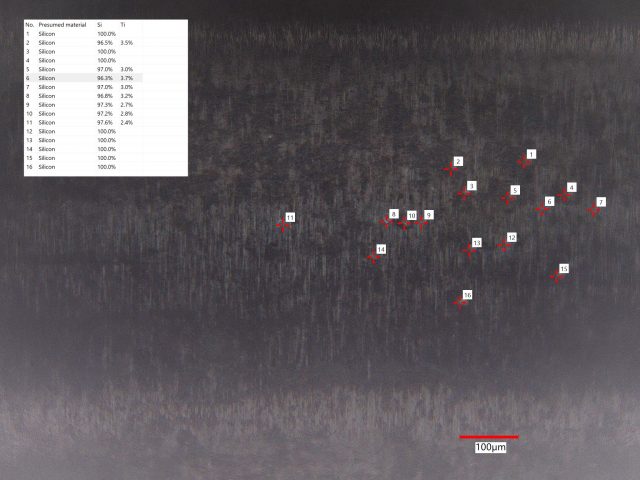
Sample 2: The gray ceramic actually consists of small domains which are black or white. The boundaries of these small domains also act to scatter light, making the overall appearance a dark gray. LIBS analysis found Si at every one of 30 sites, but low concentrations of Ti at 12 sites and Fe at one site.
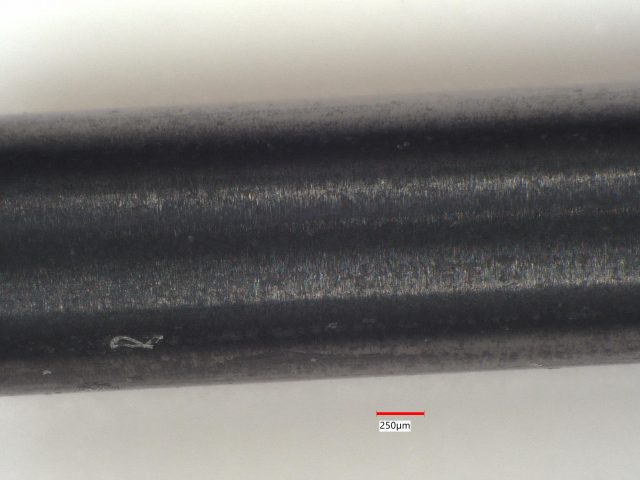
Sample 3: This gray appearing ceramic has small domains of black material and and small domains of lighter gray material. LIBS analyzed 49 sites and found mostly Si at all of them. Fe was found at 2 sites and Al was found at 2 sites.
XPS Surface Analysis
The XPS analysis was performed over an elliptical area irradiated by the low-energy (1487 eV) monochromatic aluminum Kα x-ray with a major axis of 1.28 mm and a minor axis of 0.64 mm. This is an area of approximately 0.64 mm2. The x-ray angle of incidence and the take-off angle relative to the horizontal plane is 35̊. A wide-angle (±13̊ solid angle) input lens, hemispherical analyzer, and a multi-channel detector make the spectrometer very efficient with respect to the input x-ray flux. The depth of the analyzed volume is determined by the small mean-free path of the emitted photoelectrons, such that about half the signal comes from the outer 6 nm of the surface, about 70% from the outer 10.5 nm, and about 90% from the outer 20 nm of the surface. The elemental survey spectra cover the binding energy range from 0 to 1100 eV, with a step size of 0.5 eV. This step size, with the monochromator, the moderate analyzed area size, and a high signal-to-noise ratio, provides high quantitative accuracy and sensitivity.
The XPS system consists of a turbomolecular pumped introduction chamber, an ion pumped sample preparation chamber, and an analysis chamber which is both ion pumped and pumped with a turbomolecular pump. When samples are inserted into the Analysis Chamber, they pass through the Preparation Chamber, which decreases the exposure of the Analysis Chamber to water vapor and hydrocarbons from the Introduction Chamber. Briefly on introduction into the Analysis Chamber, the pressure is typically in the low 10-8 Torr range, but within a minute of closing the gate valve to the Introduction Chamber, it is typically in the 10-9 Torr range and usually in the low 10-9 Torr range long before data acquisition has been completed. When a sample is very large or has component materials that have a high outgassing rate, the Analysis Chamber pressure may stay in the low 10-8 Torr range for a longer period of time. We also make a practice of segregating the samples of different customers to minimize cross contamination.
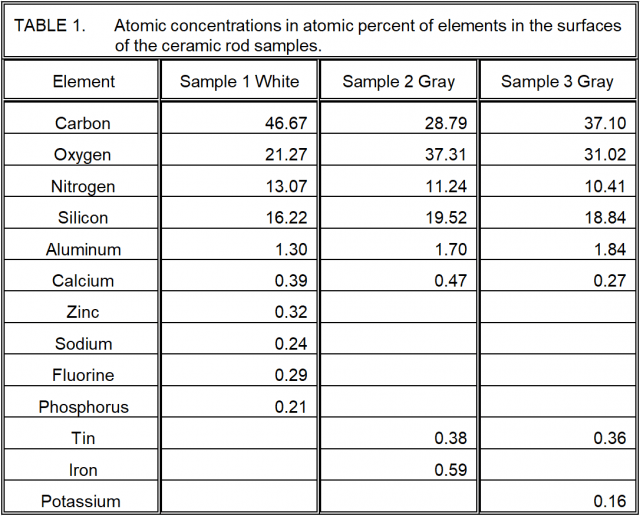
The quantitative elemental concentration results of the XPS analysis of the ceramic rods are given in Table 1 below. As with all surfaces, there is organic carbon on the surfaces. Aside from the organic material, the remaining material is clearly not pure Si3N4. First of all, other elements are present. Then note the ratios of N to Si for each sample and the fraction, f, that is of the 1.333 ratio of N to Si for pure silicon nitride:
Sample 1: N/Si = 0.8058, f = 0.6044
Sample 2: N/Si = 0.5761, f = 0.4321
Sample 3: N/Si = 0.5524, f = 0.4143
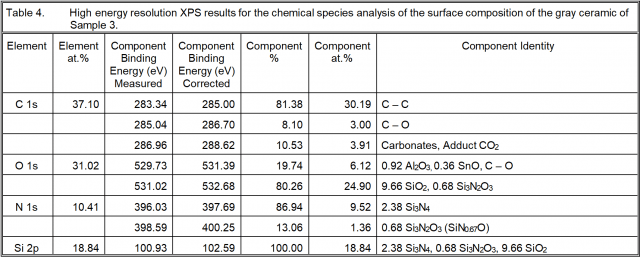
Even this understates the degree to which the ceramic is silicon nitride. Tables 2 – 4 give the chemical species for the silicon and show that each ceramic sample has both silica and silicon oxynitrides present.
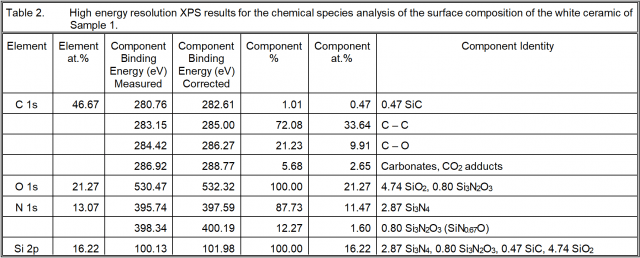
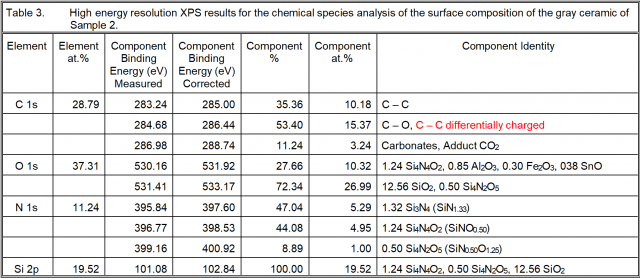
High resolution XPS analysis was also performed in order to acquire more insight into the chemistry of the “silicon nitride” ceramic surfaces. The results are given in the next three tables.
Surface Chemistry Conclusions
Sample 1: There is both Si3N4 and Si3N2O3 present where the Si in the oxynitride form as a ratio with that as the nitride is 0.80/2.87 = 0.279. There is also SiC, such that the Si in that form has a ratio with that in the silicon nitride of 0.055. The Si in the form of SiO2 is 0.551 times that as silicon nitride. The ratio of Si which is not Si3N4 to that which is Si3N4 is 0.885. Consequently, there is almost as much Si in other forms as there is as silicon nitride.
Sample 2: There is Si3N4 and two forms of silicon oxynitride, neither of which is the silicon oxynitride observed in Sample 1. There is a lower oxygen content oxynitride and a higher oxygen content form of silicon oxynitride than that of Sample 1. These are Si4N4O2 and Si4N2O5, for which the Si ratios compared to that in the form of silicon nitride are, respectively, 1.253 and 0.505. There is more Si in the form of the silicon oxynitrides than as silicon nitride. In addition, there is a ratio of Si as silica to that as silicon nitride of 12.56/3.96 = 3.17. There is both more silica and more silicon oxynitride than there is silicon nitride.
Sample 3: There is both Si3N4 and Si3N2O3 present where the Si in the oxynitride form as a ratio with that as the nitride is 0.68/2.38 = 0.286. This is the same form of silicon oxynitride as in Sample 1 and its Si ratio to that as silicon nitride is very nearly the same. The Si in the form of SiO2 is 1.353 times that as silicon nitride, so there is more silica than silicon nitride, though not so much as in Sample 2. The ratio of Si which is not Si3N4 to that which is Si3N4 is 1.639. Consequently, there is considerably more Si in other chemical forms than there is as silicon nitride.
The XPS analysis did not find the small amounts of Ti found at some sites analyzed by LIBS in Sample 2 and it did not find the low Fe concentration found at two of 49 sites by LIBS in Sample 3. The Ti of Sample 2 may have been too deep to be detected by XPS and the overall concentration of Fe in Sample 3 may have been too low to be detected or not on the surface. XPS did detect Al and Ca on all of the ceramic surfaces. It also informed us that the true silicon nitride is less than half of the ceramic material at the surfaces of these ceramics. Much of the ceramic is silica and some is silicon oxynitride.