
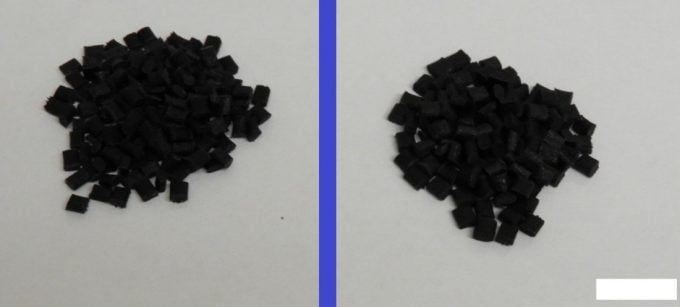
This is an example of a polymer analysis project. Two samples of a black polymer said to be nominally 30% glass filled Nylon-6 were comparatively analyzed for an injection molder to provide a better understanding of the plastic pellets before their use. The Samples A and B were believed to have similar properties. They are shown as-received in Figure 1.
FTIR Analysis
The supplied pellets were analyzed by Attenuated Total Reflectance Fourier Transform Infrared Spectroscopy (ATR-FTIR) to check that they were Nylon-6 as we had been told. FTIR is an analytical technique used to identify organic, polymeric and some inorganic materials. It is one of the most commonly used analysis techniques for polymer analysis. FTIR irradiates a material with infrared light over a range of wavelengths and measures the absorption as a function of the wavelength. The wavelength of absorption is characteristic of functional groups within the chemical structure and this allows chemicals to be identified. FTIR analysis is a good starting point for the analysis of polymeric materials. ATR-FTIR enables rapid and non-destructive analysis of polymeric samples without any significant sample preparation.
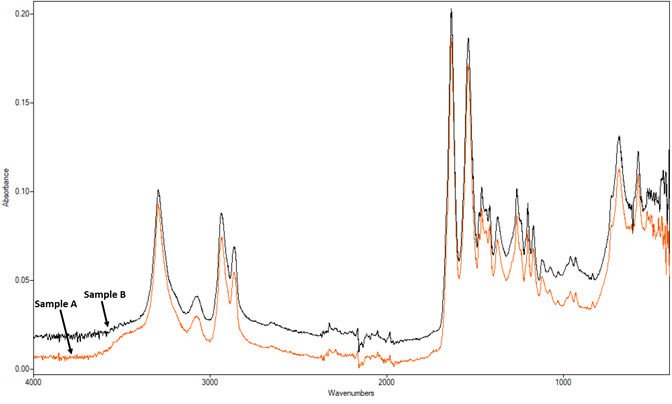
Below are the ATR-FTIR spectra of Sample A and Sample B. Their FTIR spectra match very well with each other. They show a good match with a nylon-6 library spectrum from our database.
TGA Analysis
Thermogravimetric analysis (TGA) is one of the thermal characterization techniques. TGA can be used for measuring moisture in plastic resin, volatiles and inorganic filler content as well as many other features.
We performed polymer analysis by TGA analyses on the samples. The samples were subjected to TGA analysis from room temperature to 750 °C in order to determine the moisture and ash content in a single run, in addition to the weight of the fiberglass fill. Using the gas selector accessory attached to our TGA instrument, we are able to use different purge gases such as N2, O2 or air in a single TGA run. This is cost effective for the analysis of composite materials. The moisture content of the samples evolves up to about 120 °C under nitrogen gas flow and then the organic content decomposes mostly between 400 °C and 600 °C by thermal oxidation in flowing air. At the end of the analysis, the fiberglass remains in the sample pan. The final weight is the weight of the fiberglass.
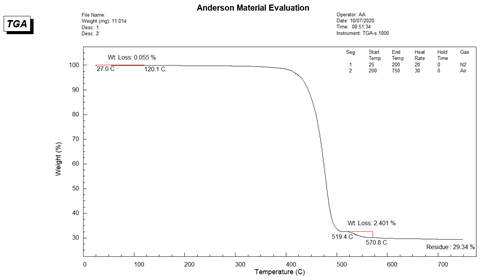
The TGA thermogram of Sample A is presented in Figure 3. As noted on the thermogram the moisture content is calculated to be 0.055% and the fiberglass content is 29.34%. The TGA thermogram has 2 major weight loss steps. At first, nylon-6 polymer was decomposed thermo-oxidatively from about 400 °C to 515 °C. Then, in the second weight loss step occurred between 519 °C and 571 °C due to the carbon black additive content which is measured to be 2.40%.
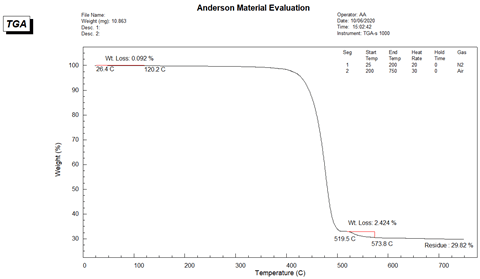
The TGA of Sample B was performed with the same program as Sample A was. The TGA thermogram of Sample B is presented in Figure 4. The moisture content is calculated to be 0.092 % and the fiberglass content is 29.82%. The second weight loss step in the thermogram between 519 and 574 °C is due to carbon black additive content which is 2.42%.
By comparative TGA analyses, it was seen that the moisture content, fiberglass content and carbon black filler content are very similar for the Sample A and Sample B pellets.
After TGA analysis all of the carbonaceous materials were removed from the sample by combustion. Thus, the initial black color prior to TGA disappeared. The remaining glass fibers in the TGA sample pan were imaged under an optical microscope (Figure 5).
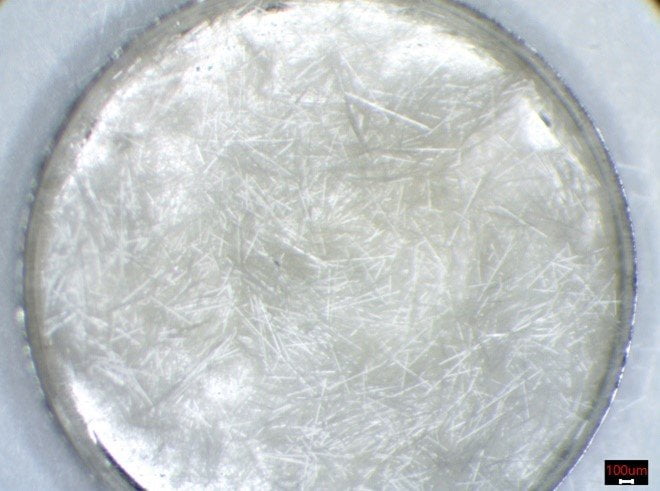
Figure 5. The remaining glass fibers after the TGA run.
DSC Analysis
The polymer analysis required the determination of the glass transition temperature (Tg) and melting temperature of the pellet samples. These were measured using DSC analysis. The sample was heated from room temperature to 300 °C at a rate of 10°C/min. A dry nitrogen gas flow was provided through the instrument at a rate of 25 mL/min. The material was held in a crimped aluminum pan for analysis.
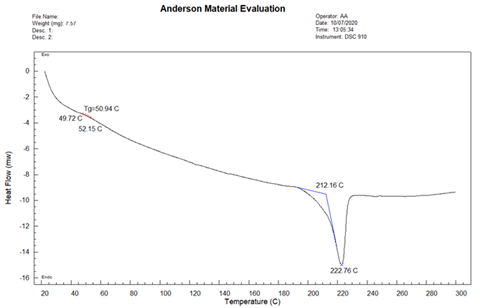
The DSC thermogram of Sample A is presented in Figure 6. The glass transition temperature (Tg) was determined to be 50.94 °C, the melting onset temperature to be 212.16 °C, and the melting peak temperature to be 222.76 °C.
The DSC thermogram of Sample B is provided in Figure 7. The glass transition temperature was determined to be 50.70 °C, the melting onset temperature was 207.51 °C, and the melting peak temperature was 219.96 °C.
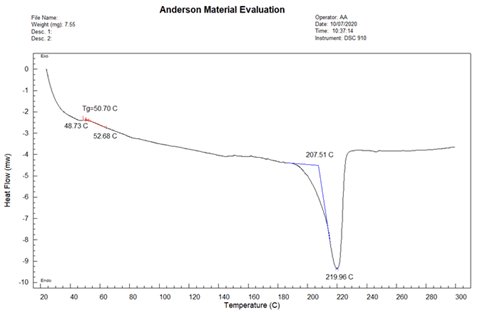
DSC analyses determined that the glass transition temperatures and melting temperatures for the Samples A and B are in the expected range for Nylon-6. This provides evidence that these samples are Nylon-6, though we could have performed FTIR analysis to confirm this. The melting onset and peak temperatures are lower for Sample B than Sample A. This indicates that the average molecular weight is lower for Sample B. In other words, the average polymer chain length is lower for Sample B. The polymer chains get shorter and show a broader weight distribution after each processing cycle due to their exposure to high temperature and pressure (e.g. injection molding). Due to the shorter polymer chains in Sample B, weaker mechanical properties would be expected in the manufactured parts made with Sample B than parts made with Sample A.
HS-SPME-GC-MS Analysis
The polymer analysis needed to include determining what volatile organic components were in the nylon-6 pellet samples. Solid-phase microextraction (SPME) is a rapid and solvent-free extraction technique. Head space (HS) SPME in combination with GC-MS was used to analyze volatile organic compounds in the nylon-6 samples. For sampling, 3 g of nylon-6 30% fiberglass pellets were placed in a vial that was sealed with a cap and then stabilized at 70 °C. The sheath of the SPME syringe was pushed through the septum on the cap and the fiber was immersed in the headspace over the pellets for 30 minutes. After 30 minutes, the SPME fiber was placed in the injection port of the GC-MS at 250 °C so that the analytes were thermally desorbed and transferred to the capillary column.
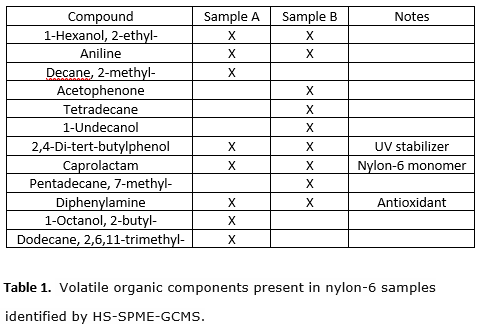
Below is the table for the compounds found in the samples. Nylon 6 is a semicrystalline polyamide. Unlike most other nylons, nylon 6 is not a condensation polymer, but instead is formed by ring-opening polymerization of caprolactam. Caprolactam is the monomer for the Nylon-6 polymer and it was found in both Sample A and Sample B. Each sample also contains additives for UV stabilization and against oxidation. Aniline was found in both samples and it can be an impurity stemming from diphenyl amine content. No plasticizer was found in either sample.
Conclusions
The polymer analysis resulted in measuring the water content, the nylon-6 resin content, the carbon black content, the fiberglass content, the glass transition temperature, the melting temperature, the comparative mean chain length, and the volatile organic components of the two polymer pellet samples.