
The DSC Analysis Technique
- DSC analysis is used to measure melting temperature, heat of fusion, latent heat of melting, reaction energy and temperature, glass transition temperature, crystalline phase transition temperature and energy, precipitation energy and temperature, denaturization temperatures, oxidation induction times, and specific heat or heat capacity.
- DSC analysis measures the amount of energy absorbed or released by a sample when it is heated or cooled, providing quantitative and qualitative data on endothermic (heat absorption) and exothermic (heat evolution) processes.
- Only non-corrosive samples can be analyzed in this very sensitive instrument. No organic or other materials containing F, Cl, Br, or I may be submitted for DSC analysis without our knowledge. The customer must either tell us what the material is or at least that it is non-corrosive to metals and assume responsibility for possible replacement of a $3000 DSC cell if a cell is destroyed as a result of the analysis of their sample. Or, you may have us perform such analysis as may be needed to determine what the material is and whether it can be analyzed in the DSC. Sometimes a higher temperature DSC to which we have access may be able to handle somewhat more corrosive samples in the lower temperature range.
- The sample is placed in a suitable pan and sits upon a constantan disc on a platform in the DSC analysis cell with a chromel wafer immediately underneath. A chromel-alumel thermocouple under the constantan disc measures the sample temperature. An empty reference pan sits on a symmetric platform with its own underlying chromel wafer and chromel-alumel thermocouple. Heat flow is measured by comparing the difference in temperature across the sample and the reference chromel wafers.
- Temperature can range from -120°C to 725°C, though an inert atmosphere is required above 600°C. The temperature is measured with a repeatability of ±0.1°C. We have access to a higher temperature DSC/DTA instrument capable of a maximum temperature of 1500°C, though it has a lower sensitivity at temperatures below 725°C compared to our primary DSC.*
- Pans of Al, Cu, Au, Pt, alumina, and graphite are available and need to be chosen to avoid reactions with samples and with regard to the temperature range of the measurement.
- Atmospheres: nitrogen, air, oxygen, argon, vacuum as low as 30 mTorr, controlled mixed gases.
- Calorimetric Specifications:
- Sensitivity: 6 μW/cm
- Precision: 1%
- Baseline noise: ±5 μW
- Baseline stability: 20 μW (ambient to 200°C); 400 μW (ambient to 600°C)
- Maximum power output is 300W
- Sample size: from 0.5mg to 100mg.
- Samples can be encapsulated in aluminum pans using a pan press
- Used to determine the thermal properties of plastics, adhesives, sealants, metal alloys, pharmaceutical materials, waxes, foods, lubricants, oils, catalysts, fertilizers, shape-memory alloys, and intermetallic compound formation
Applications of Differential Scanning Calorimetry (DSC Analysis)
- Metal alloy melting temperatures and heat of fusion.
- Metal magnetic or structure transition temperatures and heat of transformation.
- Intermetallic phase formation temperatures and exothermal energies.
- Oxidation temperature and oxidation energy.
- Exothermal energy of polymer cure (as in epoxy adhesives), allows determination of the degree and rate of cure.
- Determine the melting behavior of complex organic materials, both temperatures and enthalpies of melting can be used to determine purity of a material.
- Measurement of plastic or glassy material glass transition temperatures or softening temperatures, which change dependent upon the temperature history of the polymer or the amount and type of fill material, among other effects.
- Determines crystalline to amorphous transition temperatures in polymers and plastics and the energy associated with the transition.
- Crystallization and melting temperatures and phase transition energies for inorganic compounds.
- Oxidative induction period of an oil or fat.
- May be used as one of multiple techniques to identify an unknown material or by itself to confirm that it is the expected material.
- Determine the thermal stability of a material.
- Determine the reaction kinetics of a material.
- Measure the latent heat of melting of nylon 6 in a nylon Spandex fabric to determine the weight percentage of the nylon. Many other similar composition measurements can be performed in this way.
- Measure the latent heat of melting of nylon 6 in a nylon Spandex fabric to determine the weight percentage of the nylon. Many other similar composition measurements can be performed in this way.
- Check the quality of new stocks of resins and compare resin lots for lot to lot variations.
- Polymer contamination issues can be investigated. Even low concentrations of contaminants can be detected in many cases. This is often a more sensitive means of detection of contamination than is FTIR.
- Liquid or gas absorbed in a porous material can be heated to find the energy of desorption as a function of temperature
- TMA can also be used to measure glass transition temperatures, melting temperatures, crystalline phase formation temperatures, and crystalline to amorphous transition temperatures. It is often more sensitive to detecting the transition, but cannot measure the energy of the transition as DSC does. It also may measure the temperature more accurately when sample thermal conductivity is low or its dimensions are large since DSC has to have a higher rate of temperature change commonly to detect the transitions.
ASTM Test Methods Using DSC Analysis
- ASTM D3417 – Standard Test Method for Enthalpies of Fusion and Crystallization of Polymers by Differential Scanning Calorimetry
- ASTM D3418 – Standard Test Method for Transition Temperatures and Enthalpies of Fusion and Crystallization of Polymers by Differential Scanning Calorimetry
- ASTM D3895 – Standard Test Method for Oxidative-Induction Time of Polyolefins by Differential Scanning Calorimetry
- ASTM E793 – Standard Test Method for Enthalpies of Fusion and Crystallization by DSC
- ASTM E794 – Standard Test Method for Melting and Crystallization by DSC
- ASTM E928 – Standard Test Method for Determination of Purity by DSC
- ASTM E1269 – Standard Test Method for Determining Specific Heat Capacity by DSC
- ASTM E1356 – Standard Test Method for Glass Transition Temperatures by DSC
- ASTM E2160 – Standard Test Method for Heat of Thermally Reactive Materials by Differential Scanning Calorimetry
Illustrative Example 1: Transformation temperatures of a shape memory alloy determined by DSC Analysis
Cu-Al-Ni alloy shape memory material undergoes a martensite to austenite transformation upon heating. The lower curve of the DSC plot in the figure below shows the endotherm which results when the sample was heated at a rate of 5°C/min. from 30°C to 190°C in nitrogen gas flowing at a rate of 25ml/min. Upon cooling down, the austenite to martensite transformation yields an exotherm seen in the upper trace of the DSC plot. The temperatures of these transitions are a function of the alloy composition. There is a hysteresis in the transformation on heating and cooling which is notable. The on-set temperatures, 145.06°C on heating and 145.88°C on cooling are close, however.

Illustrative Example 2: Epoxy Mixture Characteristics Determined by DSC Analysis
The figure below shows DSC curves of a two-part room-temperature cured, low-shrinkage epoxy, with different resin to hardener ratios. The epoxies were held at room temperature for several weeks prior to the DSC measurements. The red curve shows the epoxy mixed in accordance with the manufacturer’s instructions: 5 parts of epoxy resin with 1 part of epoxy hardener. The blue DSC curve shows the result for a 4 part epoxy resin to 1 part epoxy hardener ratio. The endothermic peak temperature of the prescribed mixture is 53.64°C and that of the 4:1 ratio mixture is higher at 55.89°C. The total endothermic energies are also different. Therefore, DSC can be used as a tool for quality control of epoxy mixture ratios.

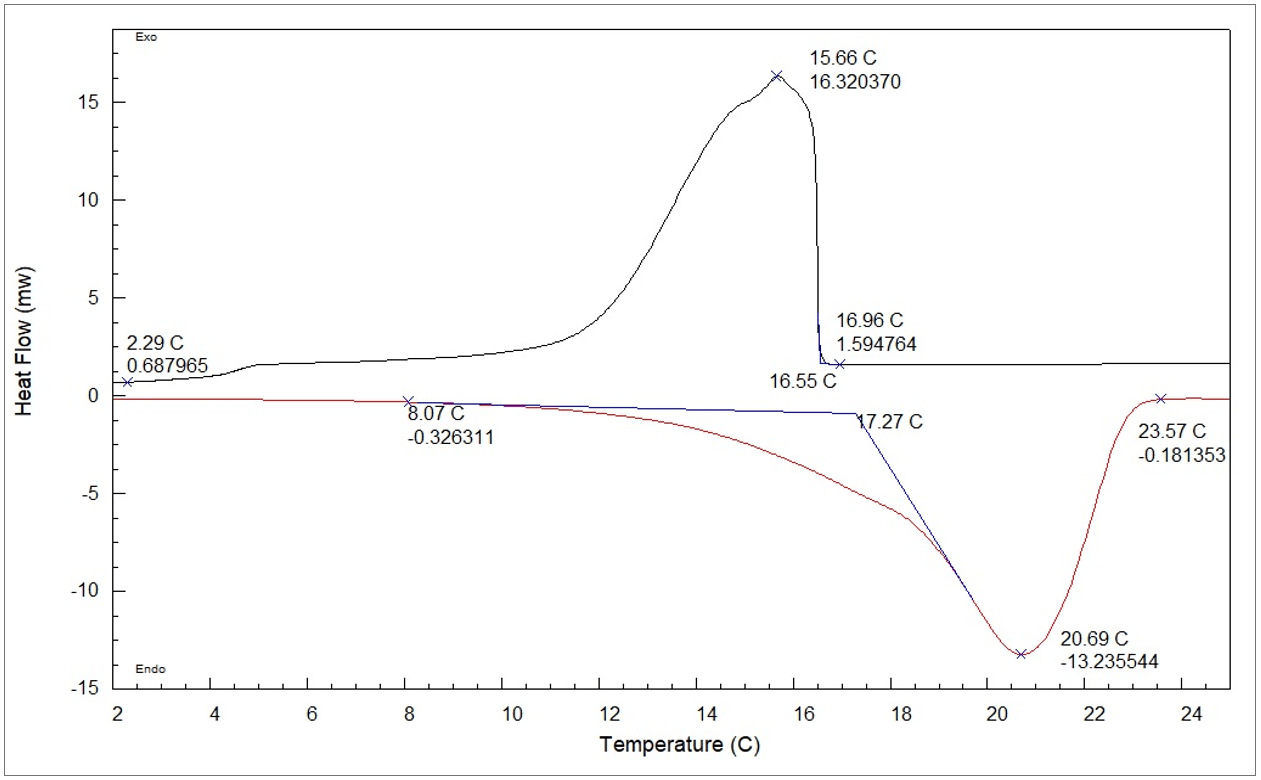
Illustrative Example 3: Phase Transition Temperatures of a Highly Crystalline Bio-Based Material
A bio-based phase changing material was expected to undergo a phase change around room temperature, but the precise phase temperatures were unknown. The DSC conditions to identify the phase transition points are given as follows: Thawing cycle: -15 ◦C to 40 ◦C at a heating rate of 2 ◦C/min in nitrogen atmosphere (25ml/min). Freezing cycle: 40 ◦C to -5 ◦C at a cooling rate of 2 ◦C /min. Liquid nitrogen was used to cool the sample to -15 ◦C. The DSC thermogram is shown below. The DSC thawing cycle analysis (red curve) shows that the amorphous phase begins to melt around 8.07 ◦C. At 18.3 ◦C the crystalline phase begins to melt, as seen by an inflection in the melting curve. The melting cycle ends at 23.57 ◦C. The DSC freezing cycle analysis (black curve) shows that the freezing cycle starts at 16.96 ◦C and the crystallization process ends at 2.29 ◦C. The crystalline phase onset temperatures of the thawing and freezing cycles are 17.27 ◦C and 16.55 ◦C, respectively. This analysis also reveals that the material is not homogenous as we can see evidence for multiple regions in both the heating and cooling cycles.
Case Histories:
Characterizing Fiberglass Reinforced Nylon-6 Pellets for Injection Molding
*1500°C DSC/DTA Instrument Referral (Not in our Laboratory)
- Ideal sample weight from 10 to 50 mg
- Temperature accuracy of +/- 1°C based on metal melting standards
- Heat flow accuracy better than +/- 2% based on metal melting standards
- DTA sensitivity of 0.001°C
- Temperature range from ambient to 1500°C
Inquiries may be addressed to contactus@andersonmaterials.com, complete a contact form on our “Contact Us” page, or directly to Vaidheeshwar Ramasubramanian, Ph.D. at Vaidheeshwar.R@andersonmaterials.com