
Introduction
One of our clients at Anderson Materials Evaluation faced a significant issue: a polymer sealing failure. The client needed to identify where the adhesion failed within a multilayer polymer film structure. We turned to X-ray photoelectron spectroscopy (XPS) for answers.
Problem and Analysis
The issue involved a heat-sealed polymer created by joining two sheets of polymer. Each sheet, provided by our client’s vendor, consisted of fluorinated ethylene-propylene (FEP) laminated to Kapton HN. During heat sealing, the FEP sides were pressed together. However, the resulting seal was weak. You could pull the polymer apart by hand.
To determine the cause, we collected XPS survey spectra from the new surfaces formed by separating the heat-sealed polymer. These surfaces were labeled as side A and side B. Figures 1 and 2 show the survey spectra.
Results
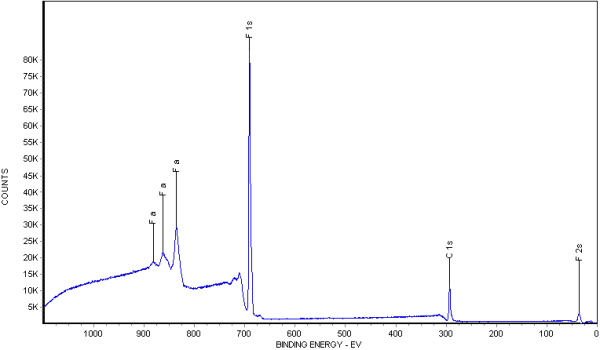
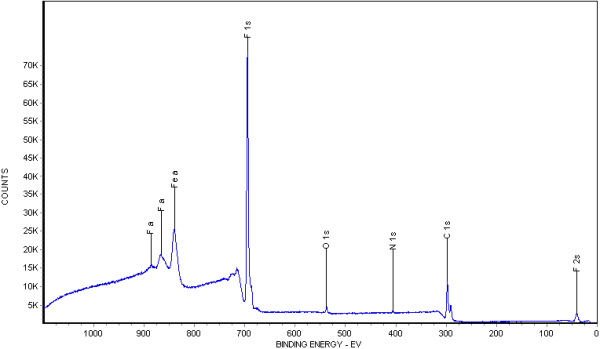
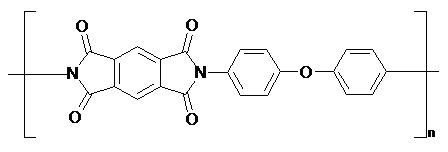
We detected only carbon and fluorine in the survey spectrum measured on side A. This finding demonstrates that only FEP (structure shown in Figure 3) is present on side A. Conversely, we found carbon, fluorine, nitrogen, and oxygen on side B. The C 1s peak in Figure 2 is split. The more intense, high binding energy peak is due to the FEP carbons, and the weaker low binding energy peak is due to Kapton HN, as shown in Figure 4.

Interpretation
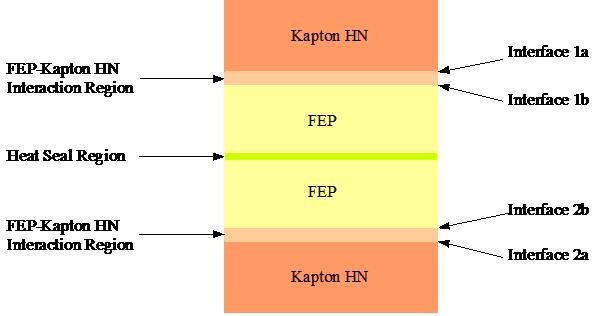
Figure 5 presents a simplified model of the heat-sealed polymer. A polymer sealing failure at interface 1b or interface 2b, or within the FEP less than 10 nm from those interfaces, would produce the XPS survey spectra we observed on surfaces A and B. Failure at any other interface or region in Figure 5 would result in a different set of spectra for the two surfaces.
The analysis revealed that the heat seal created by the client was not the source of the debonding. Instead, the failure occurred within their vendor’s product.
Conclusion
Through XPS analysis, we pinpointed the failure location within the polymer structure. This detailed understanding helps our client address the issue with their vendor and improve the reliability of their polymer sealing process.
Contact Us
If you are experiencing similar issues or have any questions about material analysis, please contact us at Anderson Materials Evaluation. Our experts are ready to help you with tailored solutions to meet your engineering and research needs.