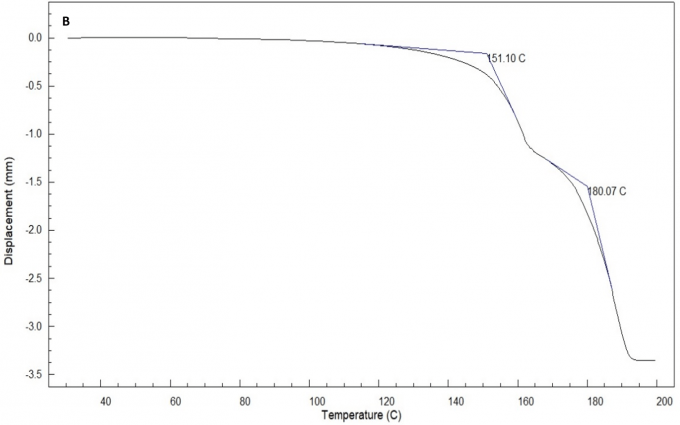
TMA thermogram showing the softening temperature with a 50g load and the melting temperature of a thermoplastic Sample B.
TMA thermogram showing the softening temperature with a 50g load and the melting temperature of a thermoplastic Sample B. The greater the load, the lower the softening temperature.

