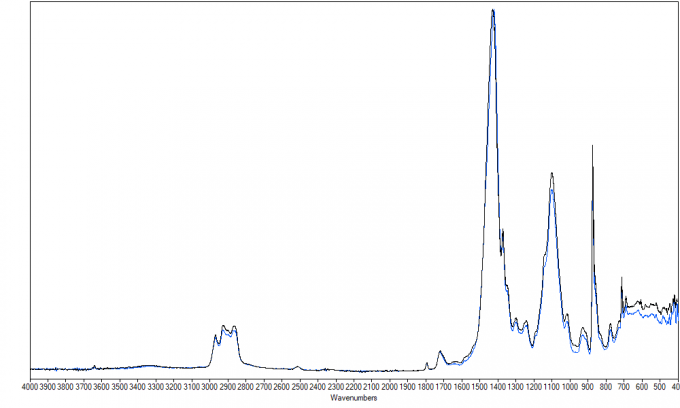
Figure 3. An overlay of the ATR-FTIR spectrum of the sample from the application site (black) and the control sample (blue).
Comments are closed.